---
title: "Is the video game movie curse lifting?"
subtitle: "TidyTuesday 2026-06-09 · Films based on video games (Wikipedia)"
date: 2026-06-09
---
::: {.callout-tip icon=false}
## Session 1 · co-developed
This page came out of a live, turn-by-turn conversation between Jon Minton and Claude
(Fable 5) — questions, plots and interpretation built together in real time. The
[Session 2 pages](index.qmd) were instead produced by Claude working autonomously.
:::
A fast (~15 minute) second session. 439 films adapted from video games, 1993–2026:
theatrical releases, direct-to-video, TV films, shorts and documentaries, with box
office, budgets and critic/audience scores where Wikipedia has them.
::: {.callout-warning}
## The ¥5 billion Pokémon trap
Sort this dataset by `worldwide_box_office` and the top eight films of all time are
all Pokémon features at "$4–5 billion" — each apparently out-grossing Avatar. They
didn't: those rows are denominated in **yen** (see `worldwide_box_office_currency`).
¥5.02bn ≈ $43m. Every box-office figure below uses dollar-denominated rows only.
:::
```{r setup}
library(tidyverse)

films <- read_csv("data/game_films.csv", show_col_types = FALSE)

theatrical <- films |>
  filter(category == "Theatrical releases", !is.na(release_date)) |>
  mutate(
    year = year(release_date),
    box_usd = if_else(worldwide_box_office_currency == "$",
                      worldwide_box_office, NA_real_)
  )

theme_set(theme_minimal(base_size = 13))
```
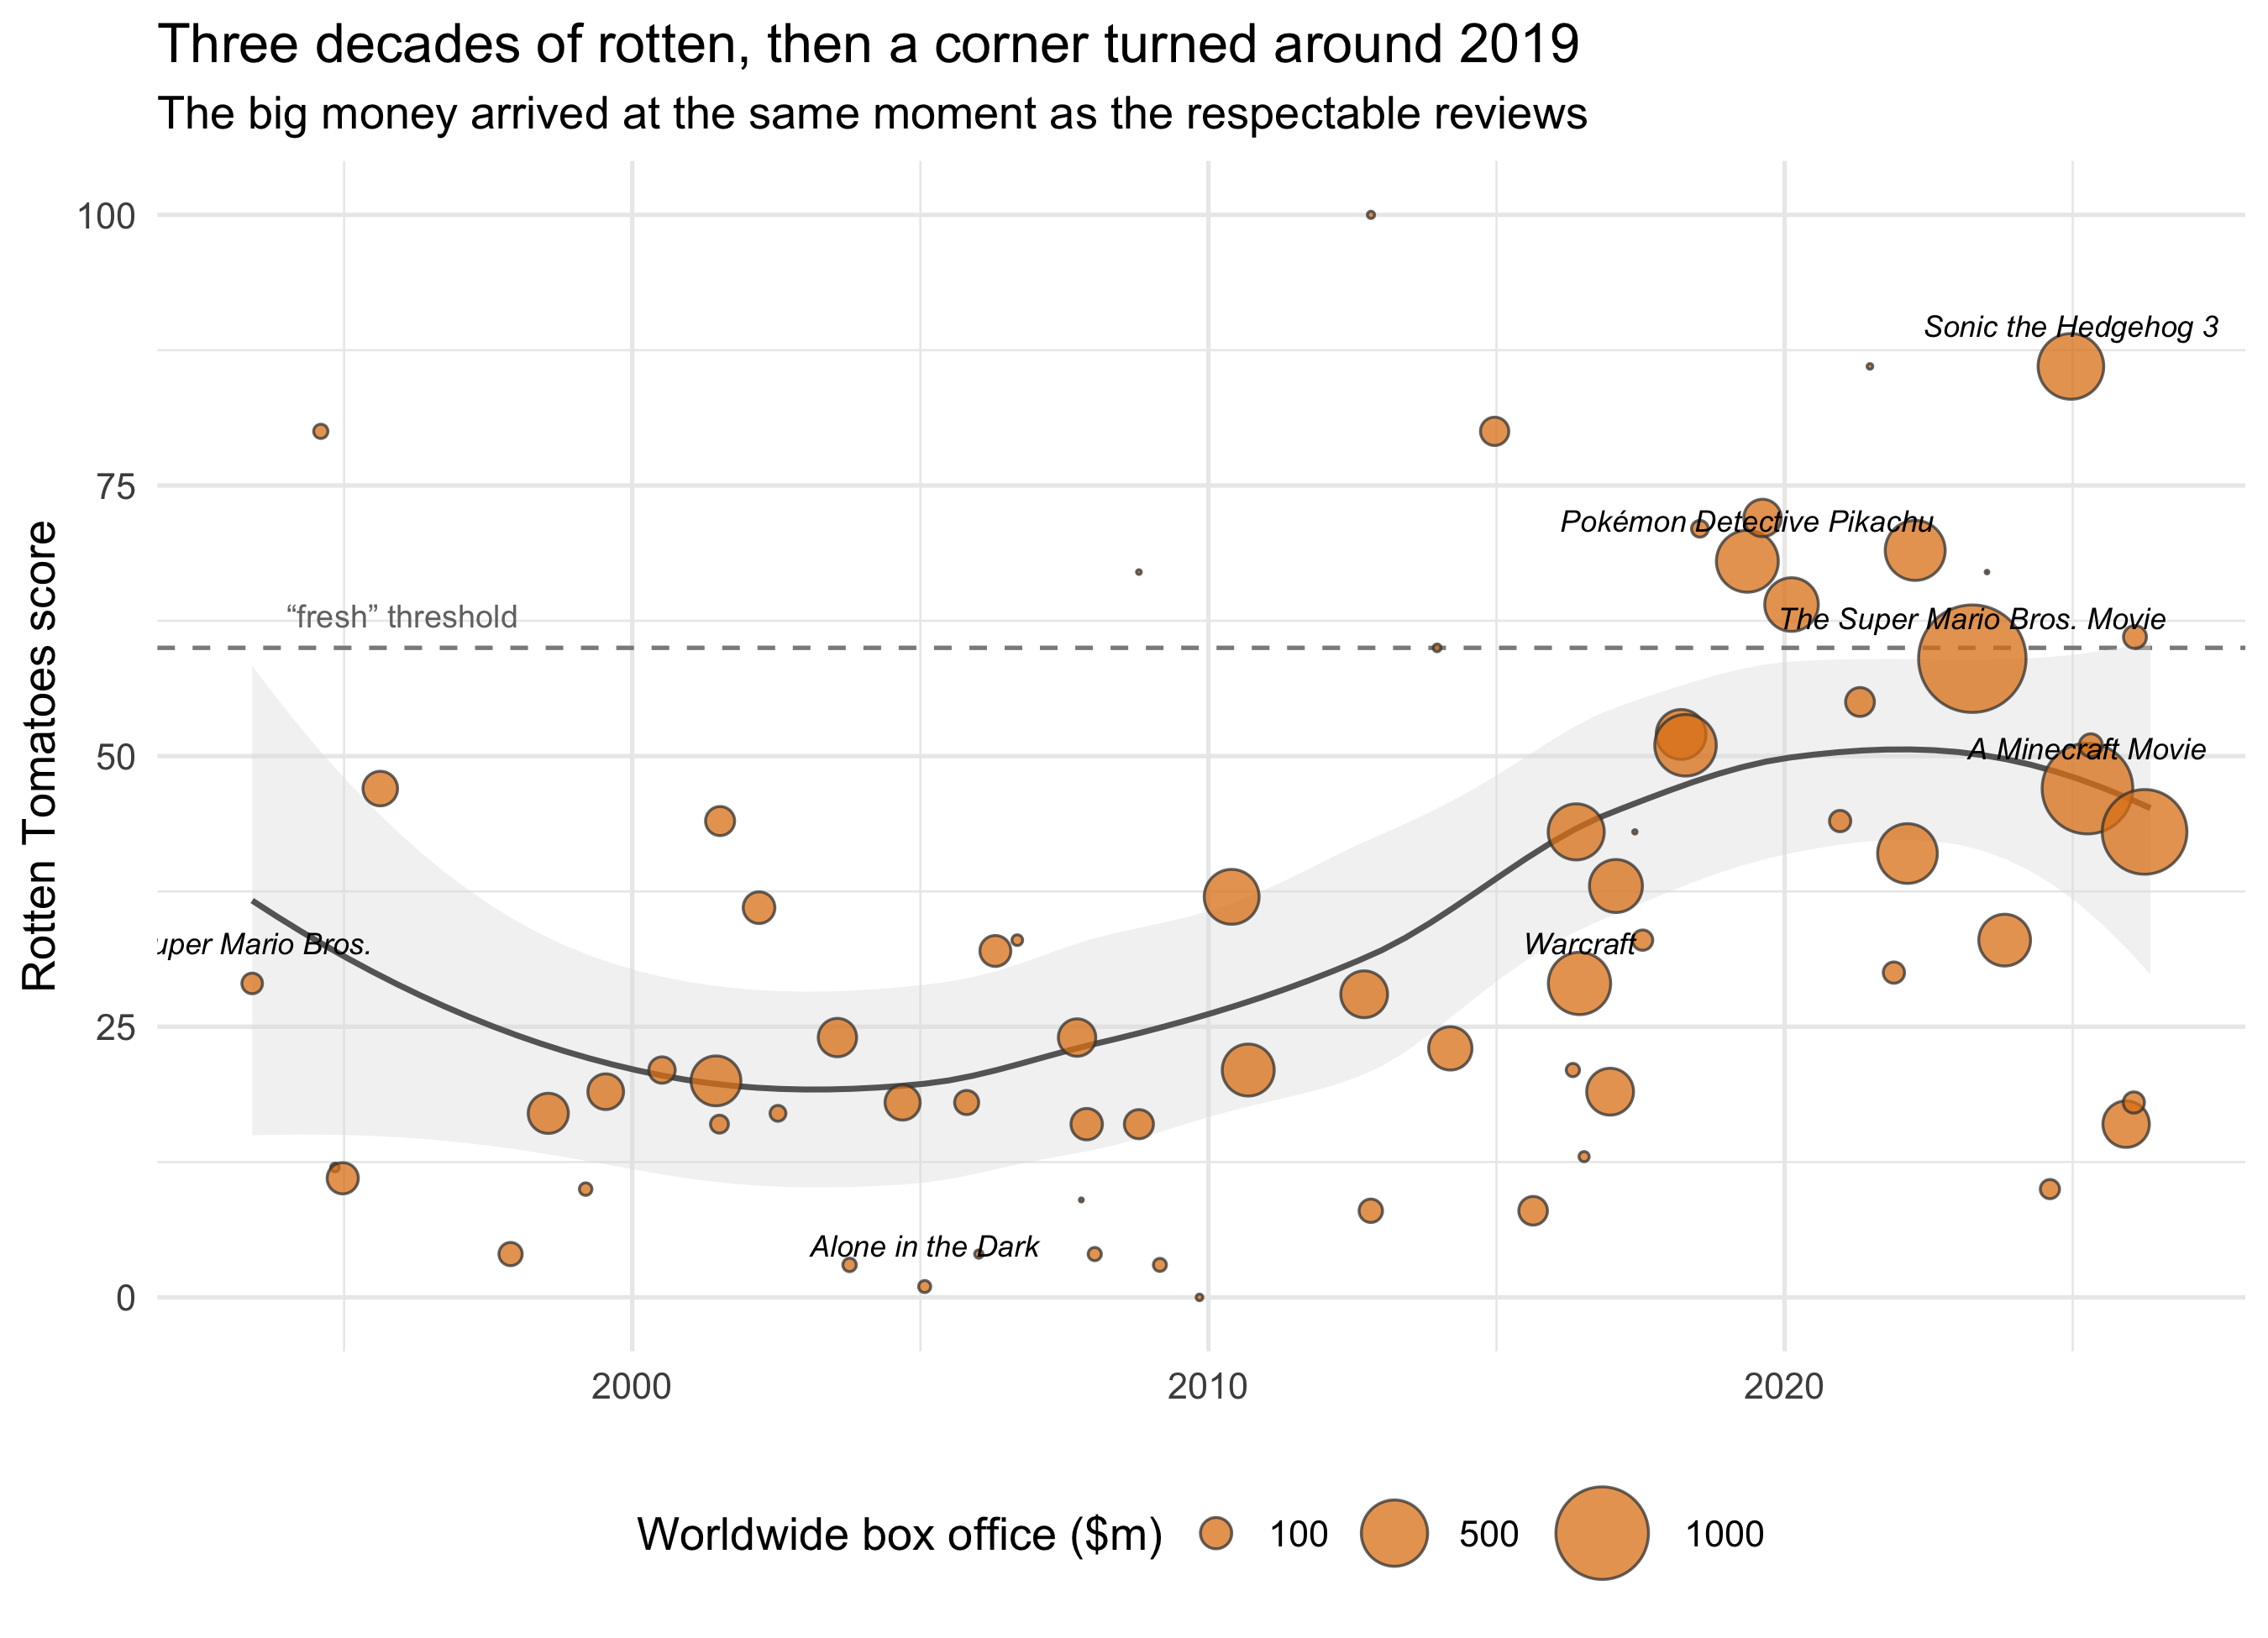
## The curse, and its apparent lifting
For its first twenty-five years, the video game adaptation was a critical punchline:
*Super Mario Bros.* (1993) set the tone at 29% on Rotten Tomatoes, and the
mid-2000s Uwe Boll era dragged the median into the teens.
```{r curse}
#| fig-height: 6.5
#| fig-cap: "Rotten Tomatoes score by release date for theatrical releases. Point area = worldwide box office (dollar-denominated films); hollow points lack box office data."
notable <- c("Super Mario Bros.", "The Super Mario Bros. Movie",
             "Sonic the Hedgehog 3", "Pokémon Detective Pikachu",
             "Warcraft", "A Minecraft Movie", "Alone in the Dark")

lab <- theatrical |> filter(title %in% notable, !is.na(rotten_tomatoes))

theatrical |>
  filter(!is.na(rotten_tomatoes)) |>
  ggplot(aes(release_date, rotten_tomatoes)) +
  geom_hline(yintercept = 60, linetype = "dashed", colour = "grey55") +
  annotate("text", x = as.Date("1994-01-01"), y = 63,
           label = "“fresh” threshold", hjust = 0, size = 3.2, colour = "grey45") +
  geom_smooth(method = "loess", se = TRUE, colour = "grey40",
              fill = "grey88", linewidth = 0.8) +
  geom_point(aes(size = box_usd / 1e6), shape = 21,
             fill = "#e08214", colour = "grey25", alpha = 0.75) +
  geom_text(data = lab, aes(label = title), size = 3,
            vjust = -1.4, fontface = "italic", check_overlap = TRUE) +
  scale_size_area(max_size = 14, name = "Worldwide box office ($m)",
                  breaks = c(100, 500, 1000)) +
  scale_y_continuous(limits = c(0, 100)) +
  labs(
    title = "Three decades of rotten, then a corner turned around 2019",
    subtitle = "The big money arrived at the same moment as the respectable reviews",
    x = NULL, y = "Rotten Tomatoes score"
  ) +
  theme(legend.position = "bottom")
```
The median Rotten Tomatoes score by half-decade tells it crisply: **17–20 from the
1990s through the late 2000s, 40 in the late 2010s, 57 in 2020–24.** And the box
office bubbles cluster in the top-right: the films that finally earned serious money
(*The Super Mario Bros. Movie*, $1.36bn; *A Minecraft Movie*; the Sonic series) are
also the ones critics stopped hating — or at least, stopped flunking.
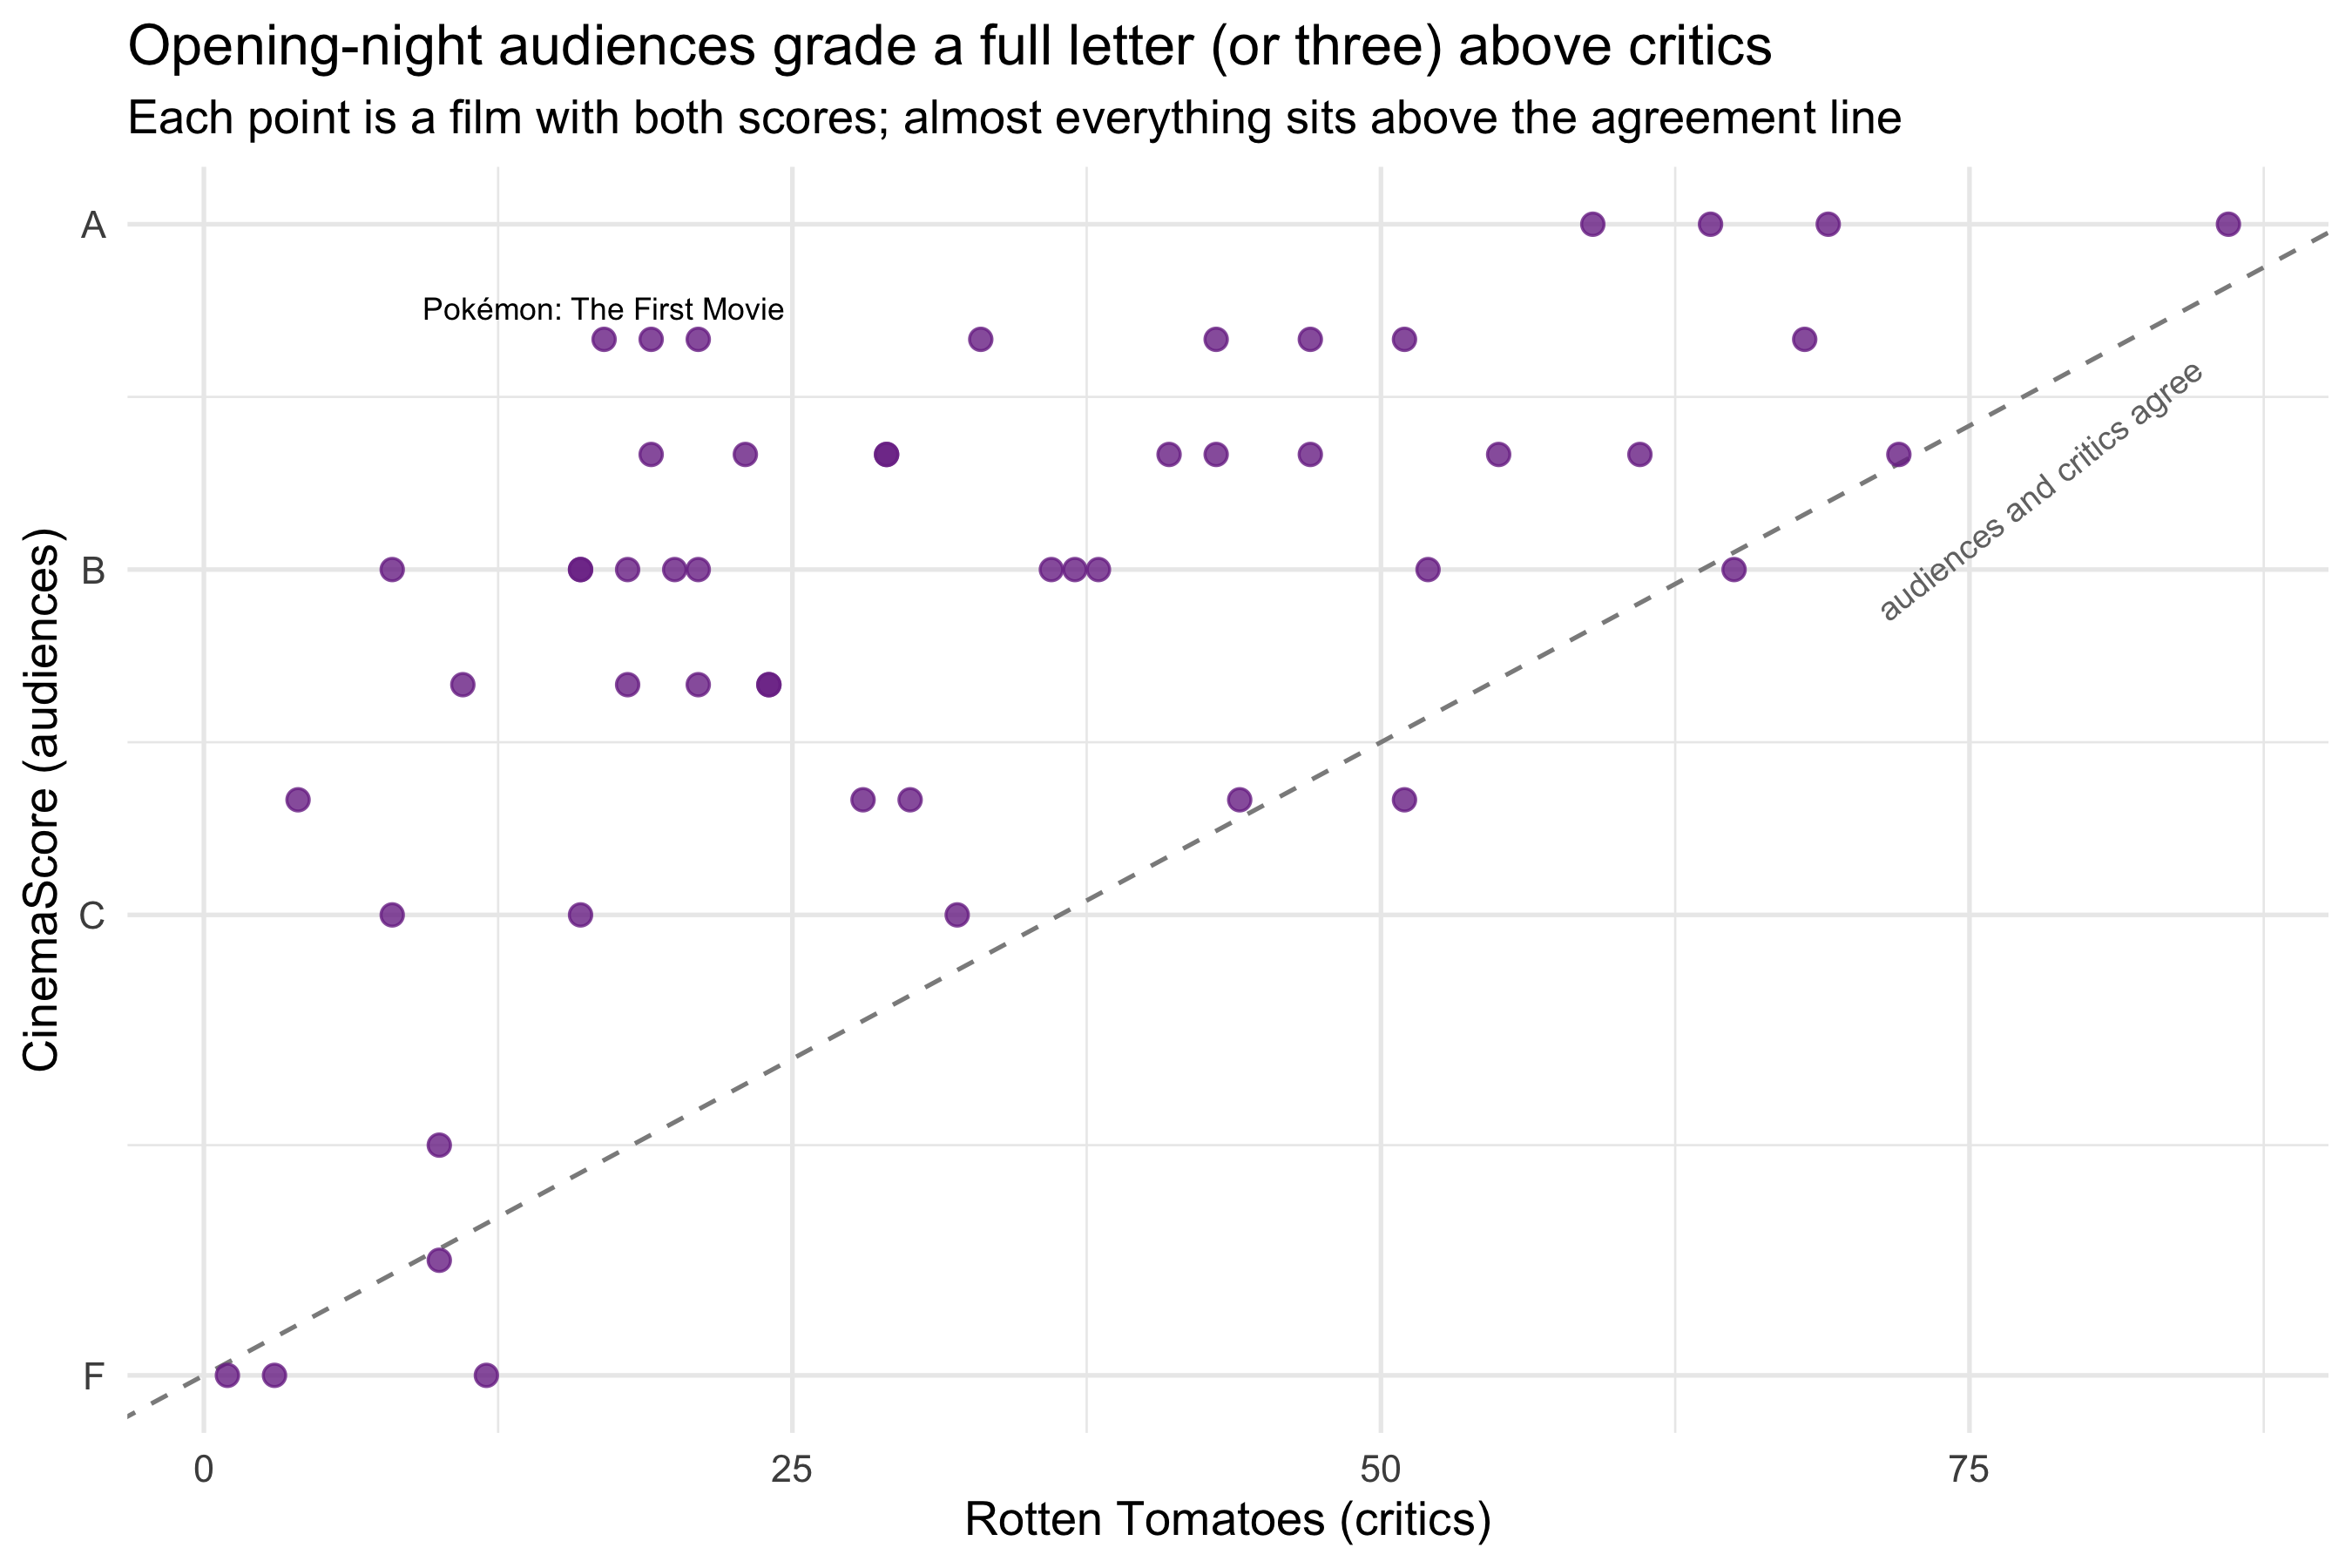
## Do audiences agree with critics? Not even slightly
CinemaScore polls opening-night audiences — people who chose to be there. Compare
those letter grades with Rotten Tomatoes:
```{r critics-vs-audiences}
#| fig-height: 6
#| fig-cap: "CinemaScore (opening-night audiences) vs Rotten Tomatoes (critics). The diagonal maps letter grades onto an equivalent 0–100 scale."
grade_levels <- c("F", "D", "D+", "C-", "C", "C+", "B-", "B", "B+", "A-", "A", "A+")
grade_score  <- set_names(seq(0, 100, length.out = 12), grade_levels)

cs <- films |>
  filter(!is.na(cinema_score), cinema_score != "N/A",
         !is.na(rotten_tomatoes)) |>
  mutate(
    cs_num = grade_score[cinema_score],
    gap = cs_num - rotten_tomatoes
  )

ggplot(cs, aes(rotten_tomatoes, cs_num)) +
  geom_abline(slope = 1, intercept = 0, linetype = "dashed", colour = "grey55") +
  annotate("text", x = 78, y = 70, label = "audiences and critics agree",
           angle = 38, size = 3.2, colour = "grey45") +
  geom_point(colour = "#7b3294", size = 2.5, alpha = 0.8) +
  geom_text(data = \(d) slice_max(d, gap, n = 3),
            aes(label = title), size = 3, vjust = -0.9, check_overlap = TRUE) +
  scale_y_continuous(breaks = grade_score[c("F", "C", "B", "A")],
                     labels = c("F", "C", "B", "A")) +
  labs(
    title = "Opening-night audiences grade a full letter (or three) above critics",
    subtitle = "Each point is a film with both scores; almost everything sits above the agreement line",
    x = "Rotten Tomatoes (critics)", y = "CinemaScore (audiences)"
  )
```
```{r gap-stats}
cs |>
  summarise(
    films = n(),
    `median critic score` = median(rotten_tomatoes),
    `median audience grade` = names(grade_score)[
      which.min(abs(grade_score - median(cs_num)))],
    `films above the line` = sum(gap > 0)
  ) |>
  knitr::kable()
```
Part of this is selection — CinemaScore samples fans on opening night, and its scale
is famously compressed (a "B" is a mediocre result by its norms). But the size of the
gap here is still striking: these were films made *for* an audience critics weren't
part of. The 2019-onward turnaround in the first chart may be less "films got better"
and more "studios finally made the films the CinemaScore audience always wanted —
competently."
## Where next
With more time: deflate box office to constant dollars; model the
review-revenue relationship with budget as a control (budget data exist for ~15% of
rows); and test whether franchise familiarity (Wikipedia's `original_game_publisher`
as a proxy) predicts the audience–critic gap.