---
title: "Thirteen males per female: an island running out of mothers"
subtitle: "TidyTuesday 2026-03-03 · Hermann's tortoises of Golem Grad, Lake Prespa"
date: 2026-06-12
---
::: {.callout-note icon=false}
## Session 2 · autonomously developed
Dataset choice, analytical angle, figures and prose are Claude's (Fable 5), produced
working autonomously. [Session 1 pages](index.qmd) were co-developed in live conversation.
:::
Golem Grad is a small island in Lake Prespa, on the borders of North Macedonia,
Albania and Greece. It carries one of the densest known populations of Hermann's
tortoise — and that density has become a trap. A [2026 paper in *Ecology
Letters*](https://onlinelibrary.wiley.com/doi/10.1111/ele.70296) reports that
sexually coercive males so badly outnumber and harass females that the island
population is in a slow, self-inflicted collapse: an "ongoing extinction event"
whose models predict the **last island female will die in 2083**.
Sixteen years of capture–recapture data (2008–2023) sit behind that sentence. This
page is an attempt to *see* the mechanism — not to model the extinction, but to lay
out, measurement by measurement, why a crowded island becomes a demographic
dead end. Three sites anchor the comparison: two on the island itself (the cliff-edged
**Plateau** and the **Beach** below it) and a mainland reference population at
**Konjsko**.
```{r setup}
library(tidyverse)

bc <- read_csv("data/tortoise_body_condition_cleaned.csv", show_col_types = FALSE)
cl <- read_csv("data/clutch_size_cleaned.csv", show_col_types = FALSE)

# Site → habitat, ordered island-first
site_levels <- c("Plateau", "Beach", "Konjsko")
hab <- c(Plateau = "Golem Grad island", Beach = "Golem Grad island",
         Konjsko = "Mainland")

bc <- bc |>
  mutate(
    locality = factor(locality, levels = site_levels),
    habitat = hab[as.character(locality)],
    Sex = recode(sex, f = "Female", m = "Male")
  )
cl <- cl |> mutate(locality = factor(locality, levels = site_levels))

island_col <- "#b5651d"   # warm terracotta = island
main_col   <- "#2f6b53"   # green = mainland
sex_pal    <- c(Female = "#c2456b", Male = "#3b6ea5")

theme_set(theme_minimal(base_size = 13))
```
## The sex ratio, three ways skewed
Every analysis starts here. Counting the **distinct individuals** ever captured at
each site — not capture events — gives the population's operational sex ratio.
```{r sex-ratio}
#| fig-height: 4.3
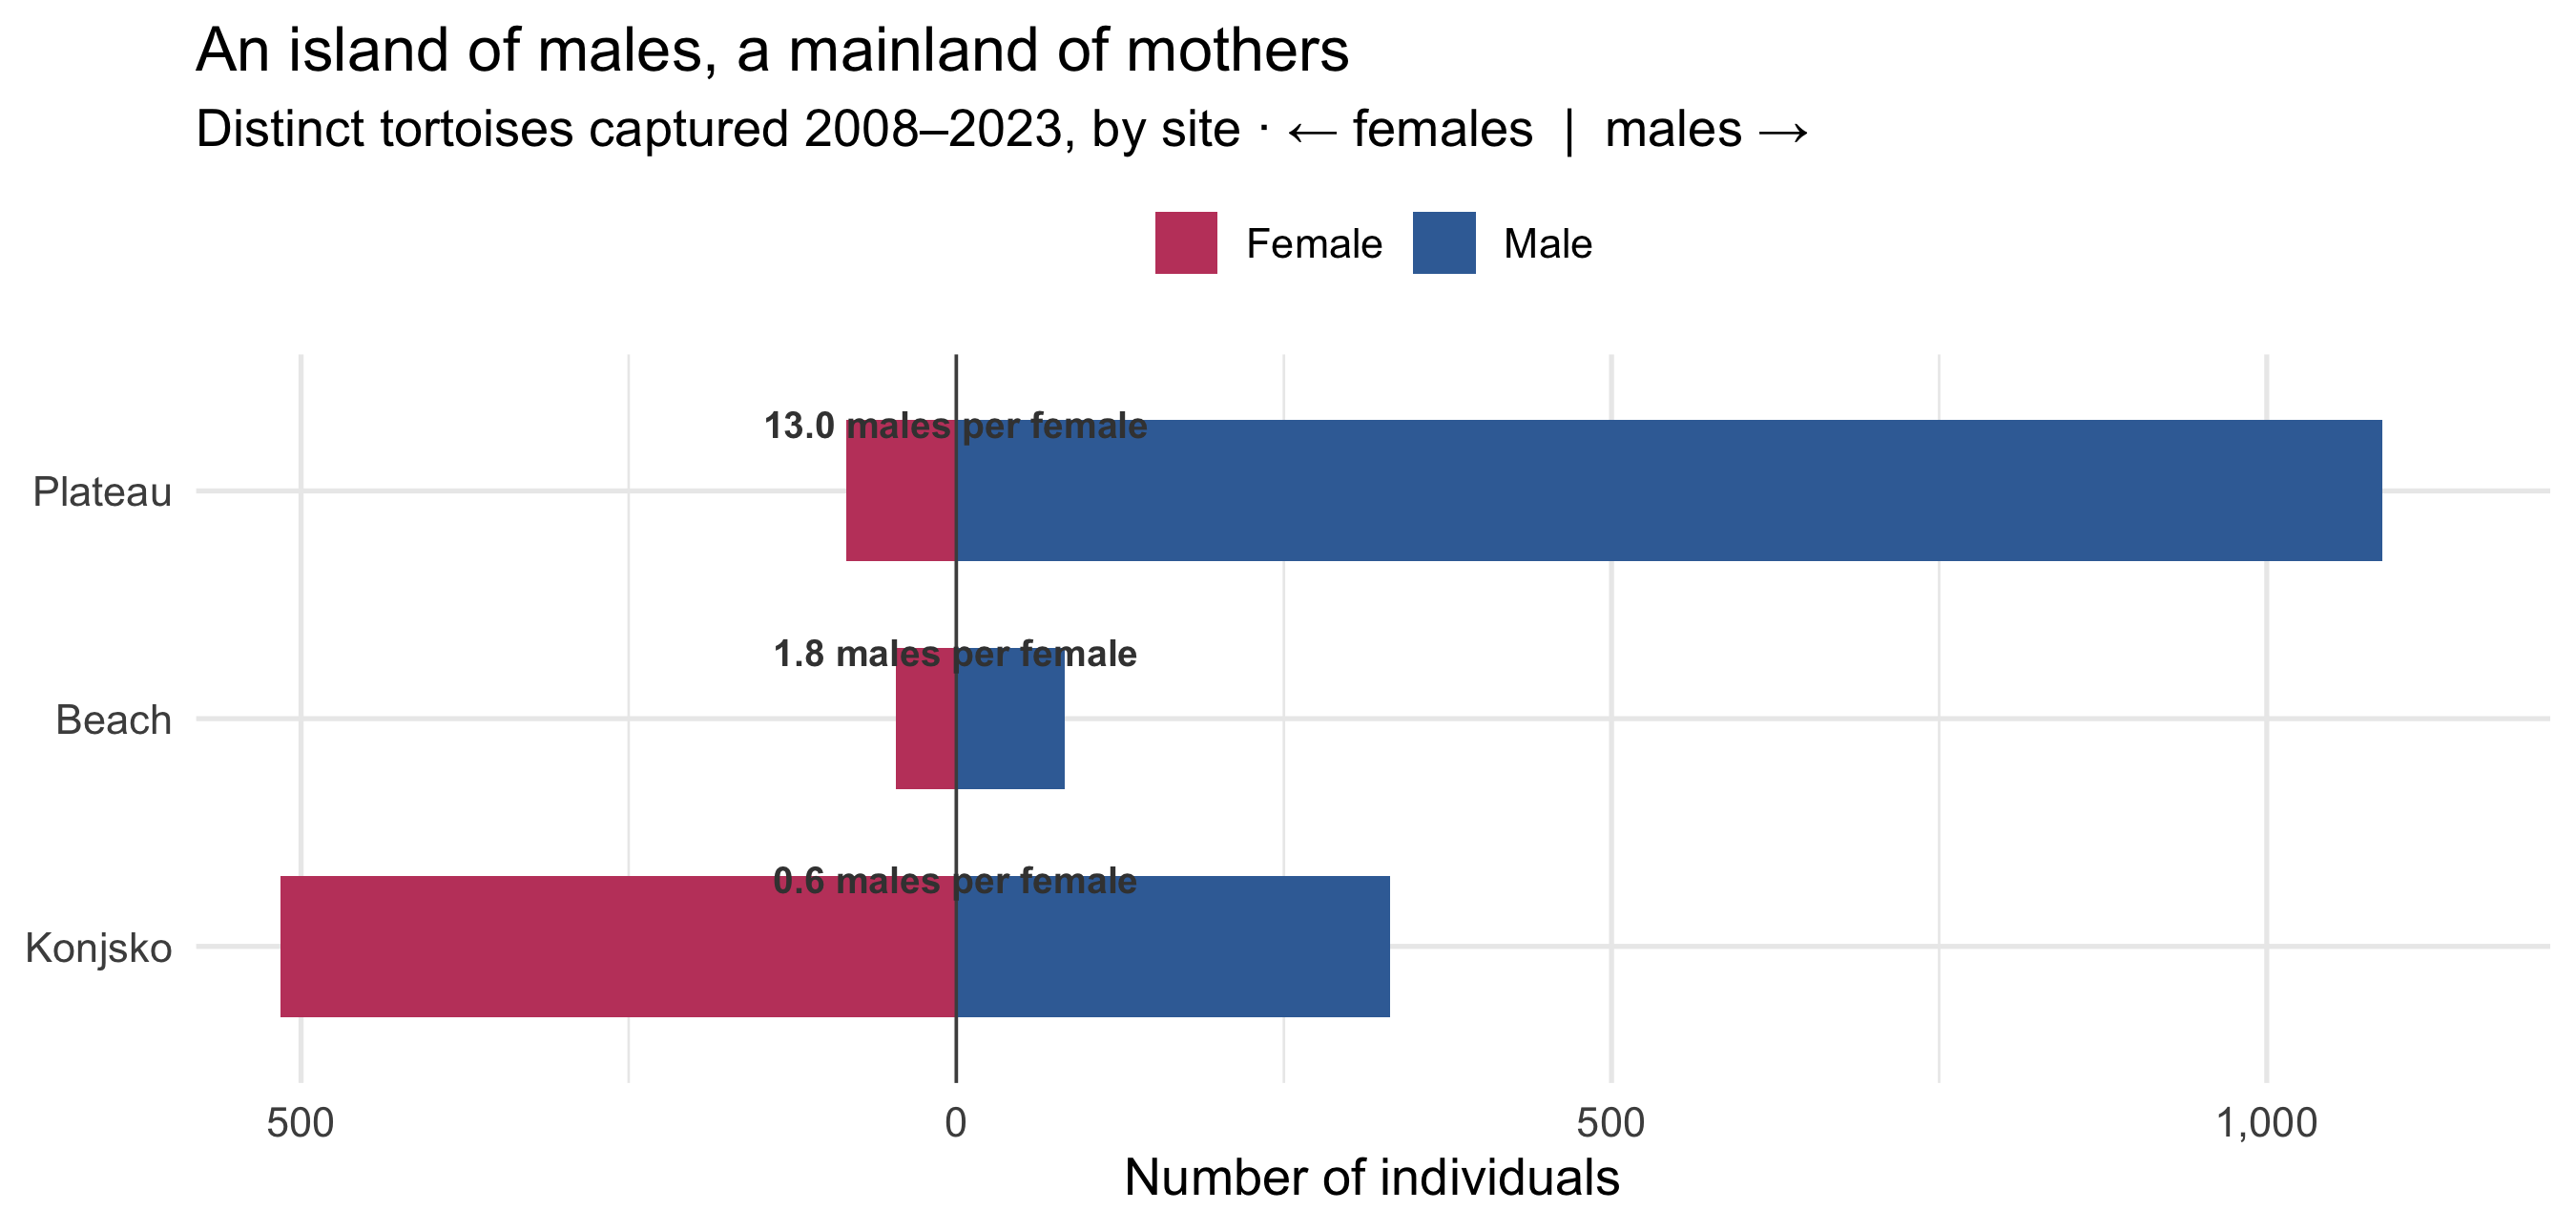
#| fig-cap: "Operational sex ratio at each site (distinct individuals, 2008–2023). The mainland is gently female-biased; the island plateau is overwhelmingly male — 13 males for every female."
sr <- bc |>
  distinct(individual, locality, habitat, Sex) |>
  count(locality, habitat, Sex) |>
  mutate(signed = if_else(Sex == "Female", -n, n)) |>
  group_by(locality) |>
  mutate(
    total = sum(n),
    ratio = n[Sex == "Male"] / n[Sex == "Female"]
  ) |>
  ungroup()

ratio_lab <- sr |>
  distinct(locality, habitat, ratio, total) |>
  mutate(lab = sprintf("%.1f males per female", ratio))

ggplot(sr, aes(signed, fct_rev(locality), fill = Sex)) +
  geom_col(width = 0.62) +
  geom_vline(xintercept = 0, colour = "grey30", linewidth = 0.4) +
  geom_text(
    data = ratio_lab, inherit.aes = FALSE,
    aes(x = 0, y = fct_rev(locality), label = lab),
    vjust = -2.0, size = 3.3, colour = "grey25", fontface = "bold"
  ) +
  scale_fill_manual(values = sex_pal) +
  scale_x_continuous(
    labels = \(x) scales::comma(abs(x)),
    expand = expansion(c(0.04, 0.08))
  ) +
  labs(
    title = "An island of males, a mainland of mothers",
    subtitle = "Distinct tortoises captured 2008–2023, by site · ← females  |  males →",
    x = "Number of individuals", y = NULL, fill = NULL
  ) +
  theme(legend.position = "top")
```
The contrast is the whole story in miniature. At the mainland site, females
*outnumber* males (0.6 males per female) — the unremarkable state of a healthy
tortoise population. On the island beach, males edge ahead (1.8:1). On the island
plateau, the ratio explodes to **13 males per female**. Of 1,172 plateau tortoises
ever caught, just 84 were female.
A skewed adult sex ratio is not, on its own, fatal — one male can fertilise many
females. What makes it lethal here is what the crowding *does* to the few females
that remain.
## The cost written on the body
The dataset's body-condition index (BCI) is mass adjusted for skeletal size: how much
tortoise there is per millimetre of shell. Plotting raw mass against carapace length
shows the females of each habitat as separate populations.
```{r body-condition}
#| fig-height: 5.6
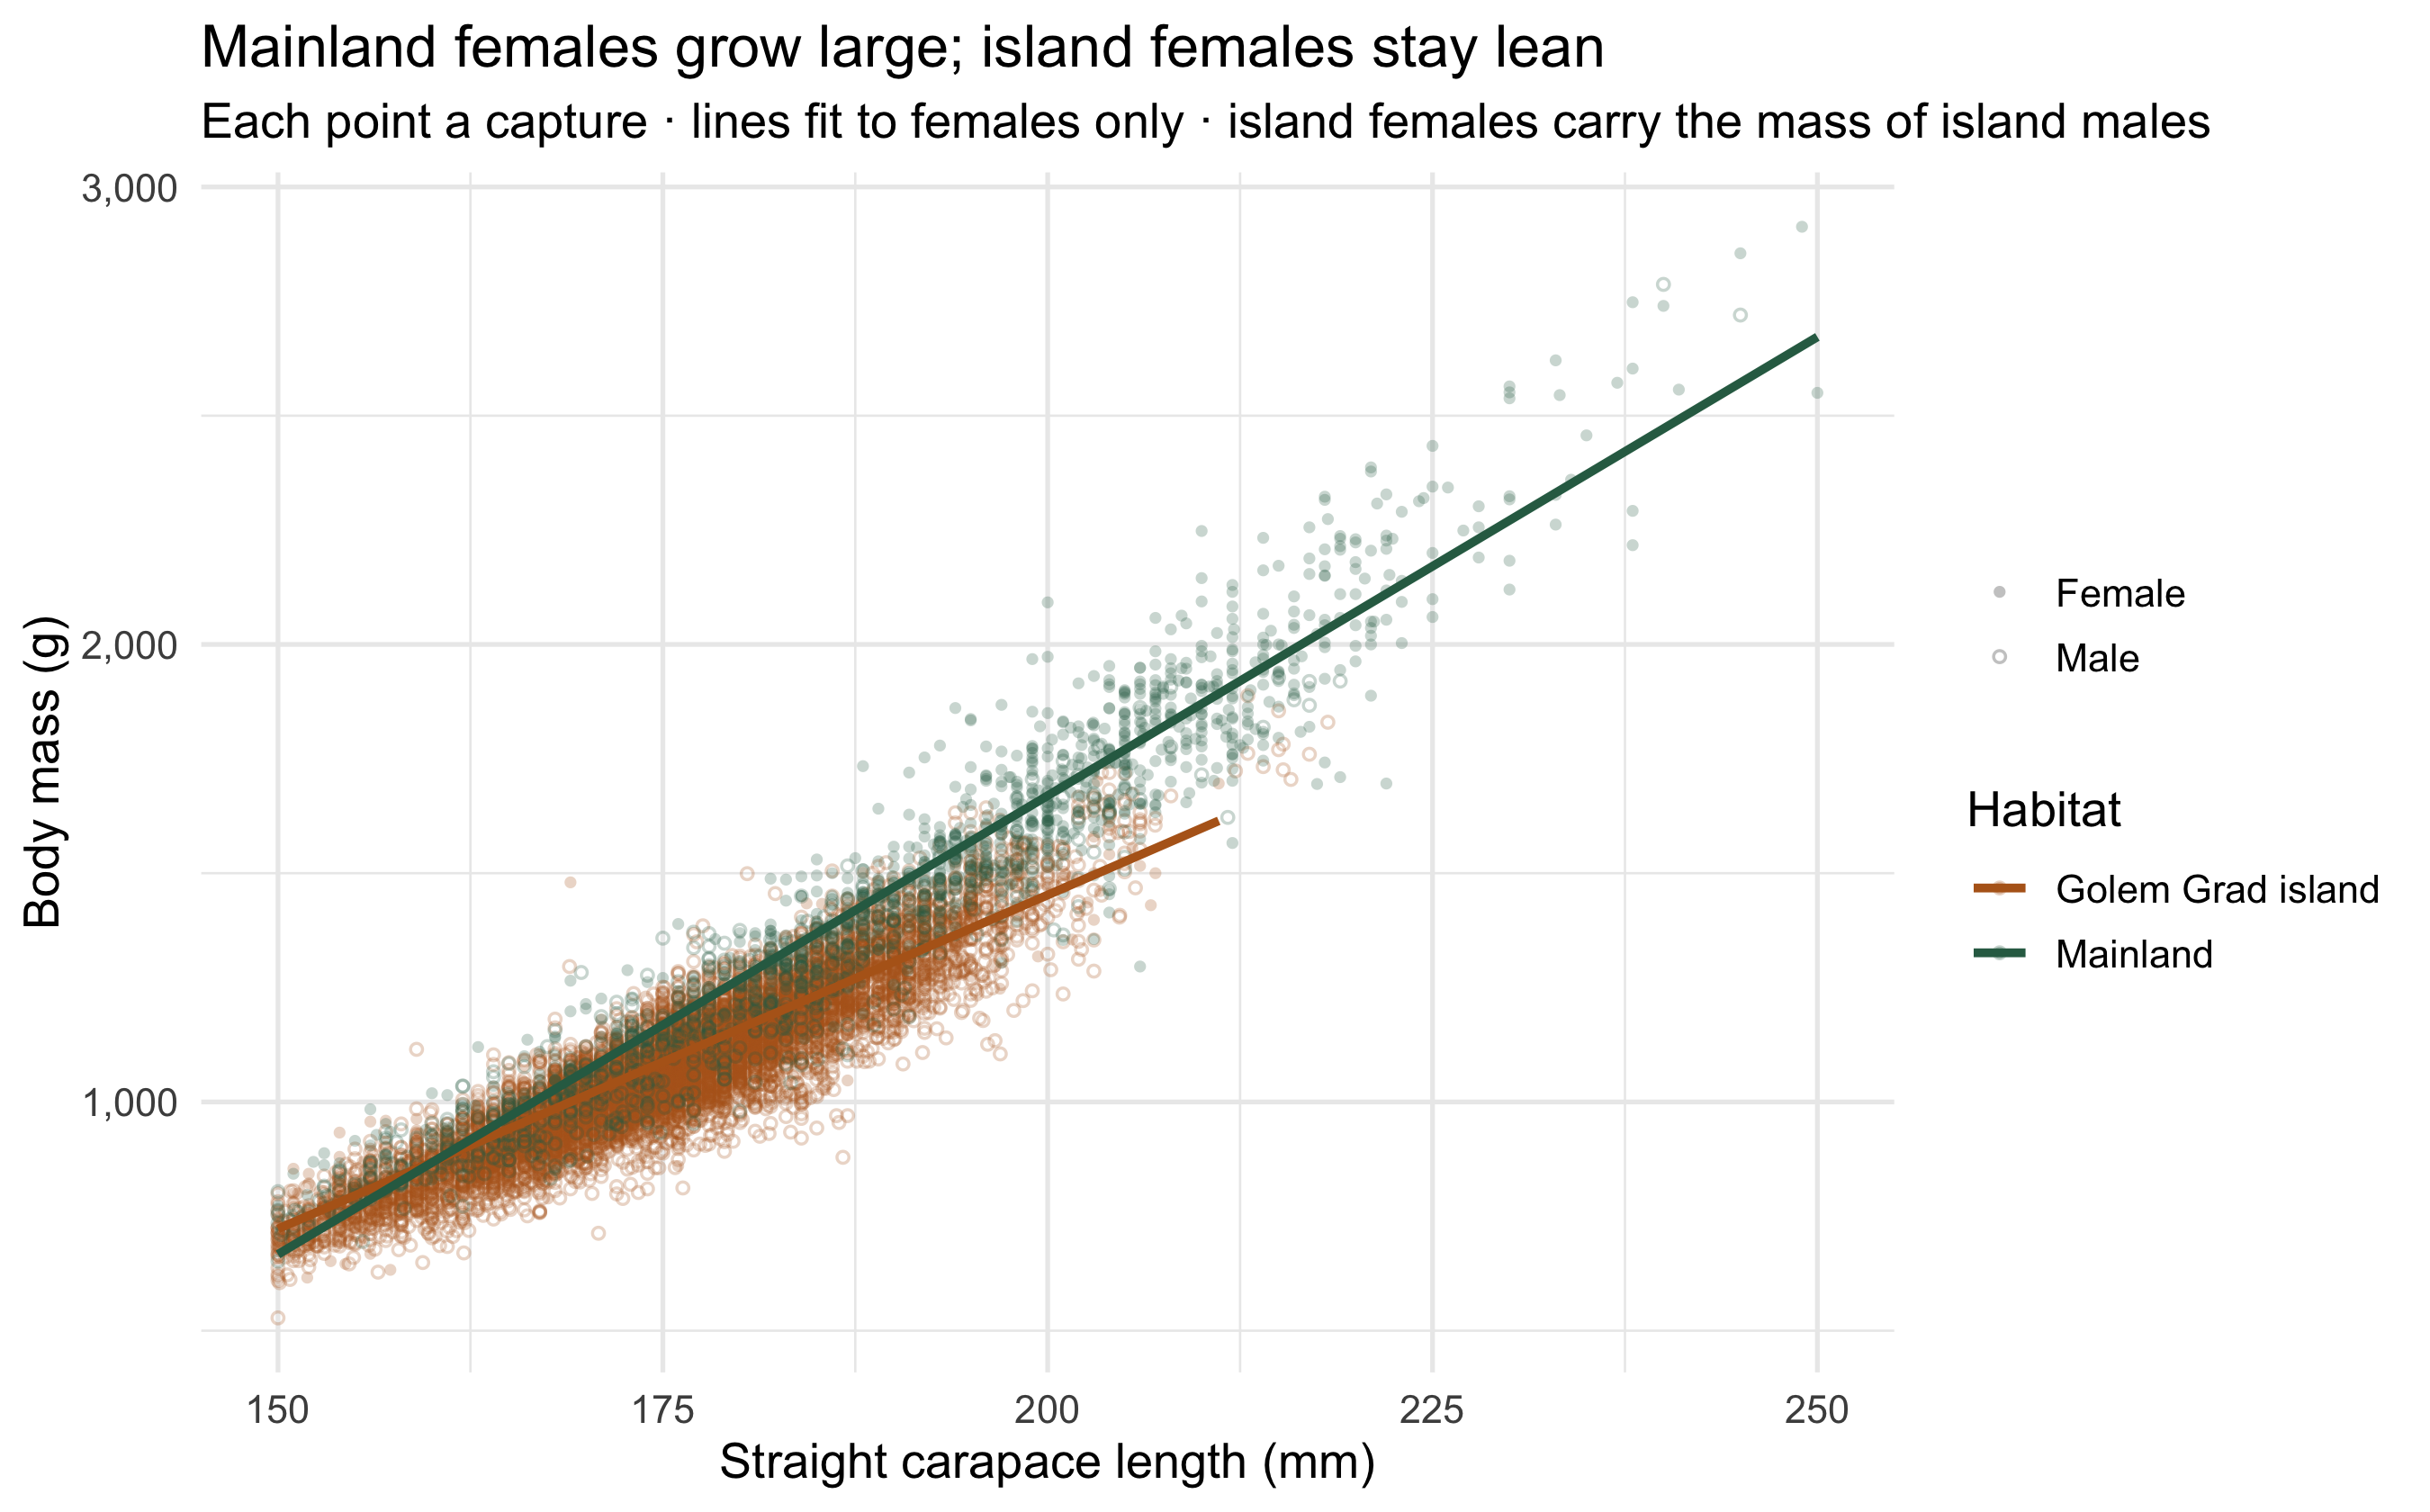
#| fig-cap: "Body mass vs carapace length for every capture. Mainland females (green) form a distinct heavy cluster; island females (orange) overlap the males, carrying far less mass for their size."
fem <- bc |> filter(Sex == "Female")

ggplot(bc, aes(straight_carapace_length_mm, body_mass_grams)) +
  geom_point(aes(colour = habitat, shape = Sex), alpha = 0.25, size = 1.1) +
  geom_smooth(
    data = fem, aes(colour = habitat, group = habitat),
    method = "lm", se = FALSE, linewidth = 1.1, formula = y ~ x
  ) +
  scale_colour_manual(values = c(`Golem Grad island` = island_col,
                                 Mainland = main_col)) +
  scale_shape_manual(values = c(Female = 16, Male = 1)) +
  scale_y_continuous(labels = scales::comma) +
  labs(
    title = "Mainland females grow large; island females stay lean",
    subtitle = "Each point a capture · lines fit to females only · island females carry the mass of island males",
    x = "Straight carapace length (mm)", y = "Body mass (g)",
    colour = "Habitat", shape = NULL
  )
```
A mainland female averages **1,615 g**; an island-plateau female just **1,105 g** —
a third lighter, despite similar shell lengths. Her body-condition index (8.1 vs 6.2)
tells the same story. The island females are not small tortoises; they are
*emaciated* ones, worn down by constant harassment, injury and the energetic cost of
fleeing — exactly the mechanism the paper documents. And body mass is not a vanity
metric for a tortoise. It is the currency of reproduction.
## Why lean females mean few eggs
A separate dataset records clutch sizes for 53 nesting females. Egg number scales
almost linearly with body mass — and that single relationship converts the
body-condition gap directly into a fertility gap.
```{r clutch}
#| fig-height: 5
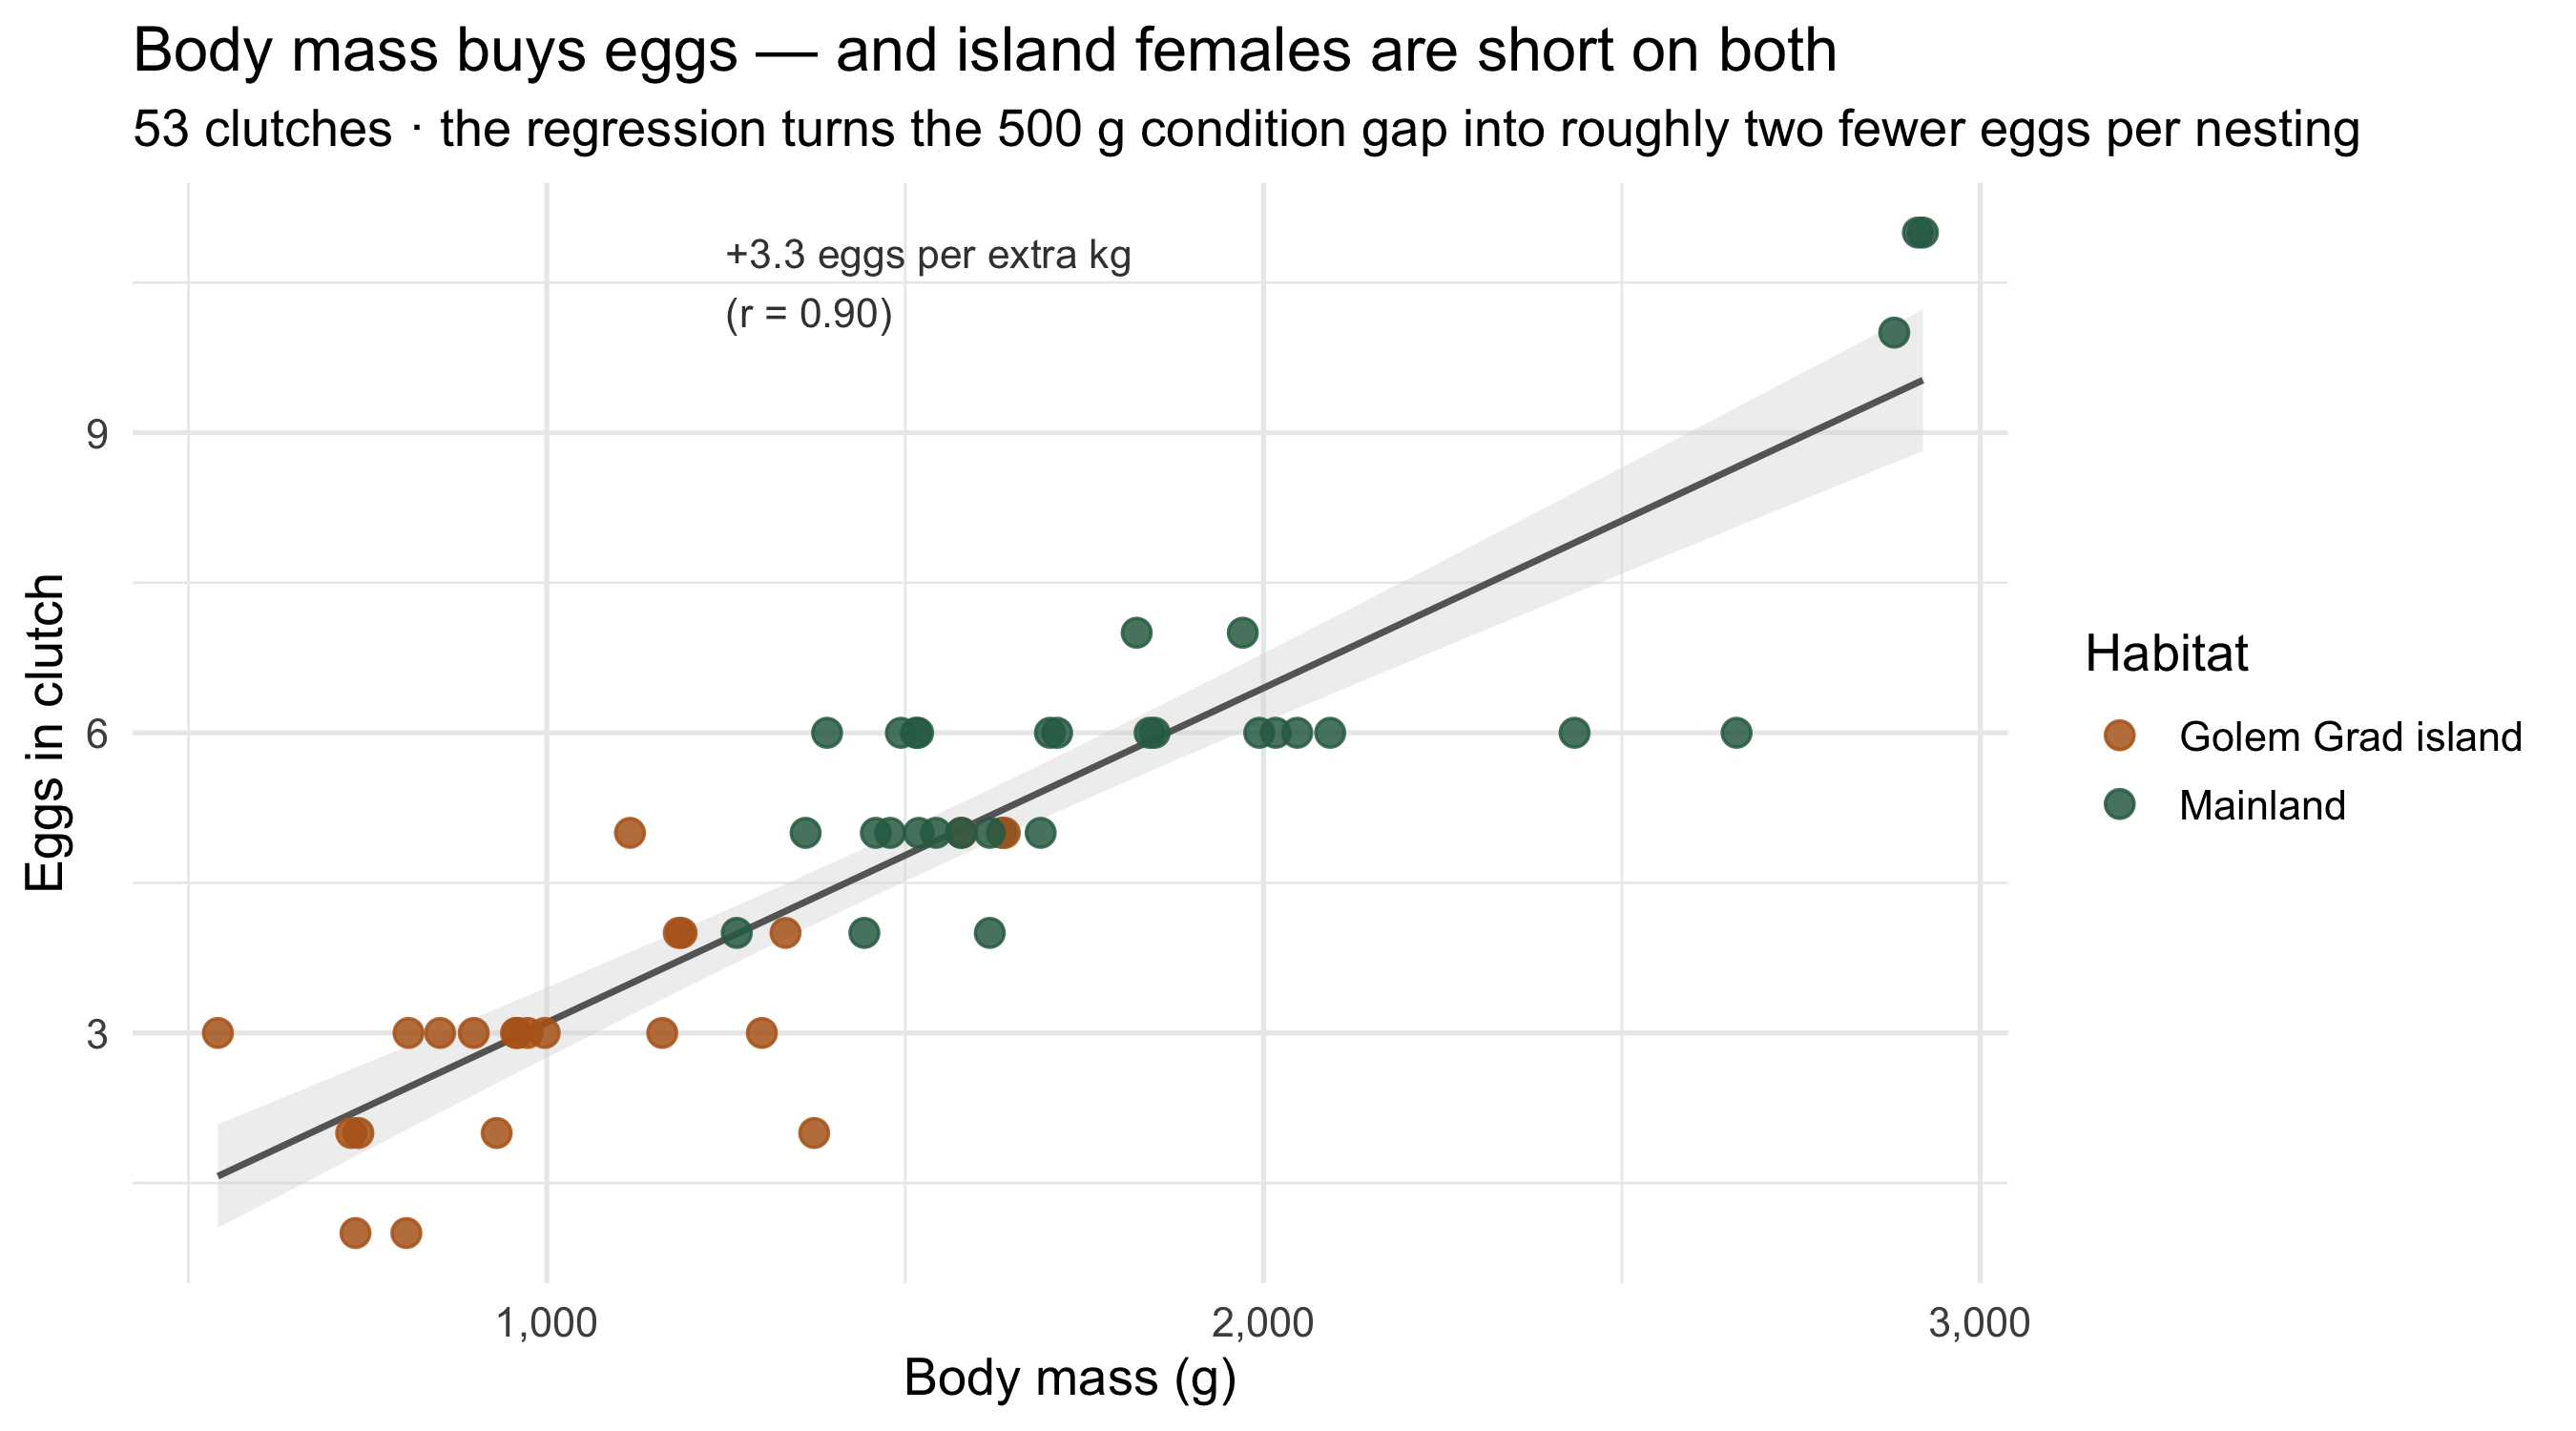
#| fig-cap: "Clutch size against body mass for 53 nesting females. Each kilogram of body mass buys ~3.3 more eggs; island females (orange) cluster at the low-mass, low-egg corner the mainland females (green) have left behind."
fit <- lm(eggs ~ body_mass_grams, data = cl)
slope_per_kg <- coef(fit)[["body_mass_grams"]] * 1000

cl_hab <- cl |> mutate(habitat = hab[as.character(locality)])

ggplot(cl_hab, aes(body_mass_grams, eggs)) +
  geom_smooth(method = "lm", formula = y ~ x, colour = "grey40",
              fill = "grey85", linewidth = 0.8) +
  geom_point(aes(colour = habitat), size = 3, alpha = 0.85) +
  scale_colour_manual(values = c(`Golem Grad island` = island_col,
                                 Mainland = main_col)) +
  scale_x_continuous(labels = scales::comma) +
  annotate("text", x = 1250, y = 10.5,
           label = sprintf("+%.1f eggs per extra kg\n(r = %.2f)",
                           slope_per_kg, cor(cl$eggs, cl$body_mass_grams)),
           hjust = 0, size = 3.6, colour = "grey25") +
  labs(
    title = "Body mass buys eggs — and island females are short on both",
    subtitle = "53 clutches · the regression turns the 500 g condition gap into roughly two fewer eggs per nesting",
    x = "Body mass (g)", y = "Eggs in clutch", colour = "Habitat"
  )
```
The relationship is tight (r = 0.90). A mainland female lays around **6 eggs**; an
island female, **3–4**. The 500-gram condition deficit alone costs roughly **two
eggs per clutch** — before accounting for the fact that harassed island females also
nest *less often*.
## The compounding trap
Stack the three findings and the "demographic suicide" of the paper's title stops
being rhetorical. Picture 100 island tortoises against 100 on the mainland:
```{r compound}
#| fig-height: 4.6
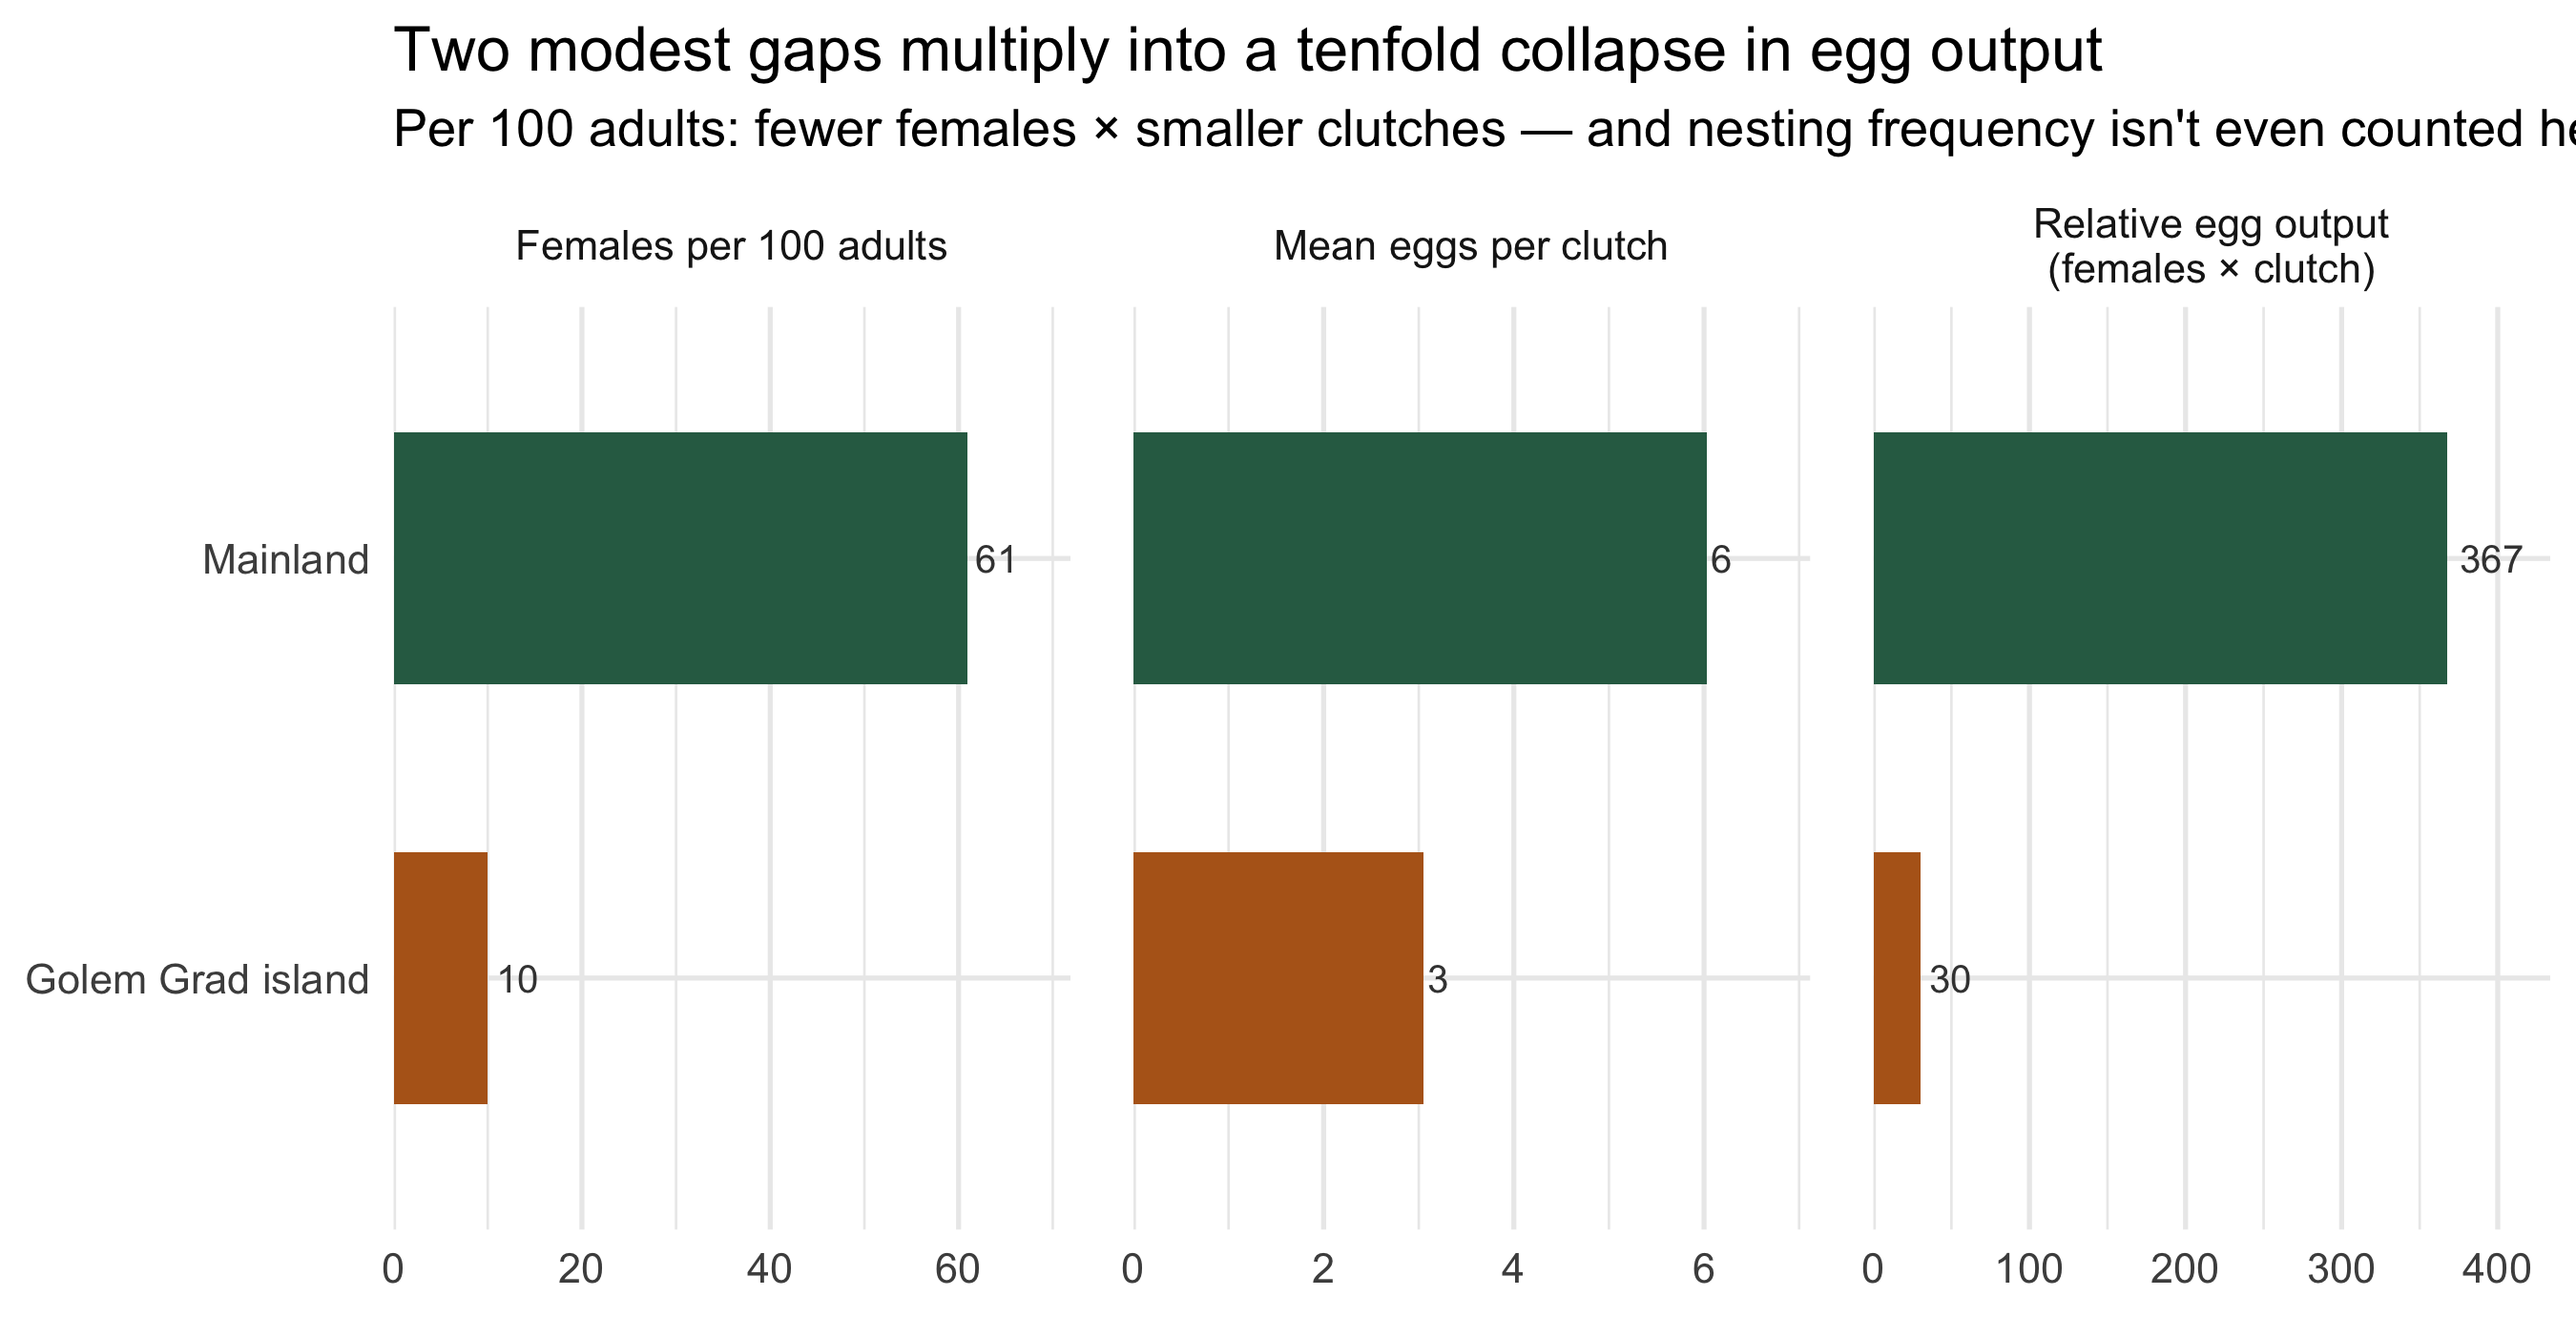
#| fig-cap: "A back-of-envelope reproductive accounting per 100 adults, combining the three measured gaps: how many are female, their relative clutch size, and the resulting relative egg output. Illustrative — it chains observed averages, not a population model."
# Per-100-adult reproductive accounting from the observed averages
fem_share <- bc |>
  distinct(individual, habitat, Sex) |>
  count(habitat, Sex) |>
  group_by(habitat) |>
  summarise(females_per_100 = 100 * n[Sex == "Female"] / sum(n), .groups = "drop")

clutch_by_hab <- cl |>
  mutate(habitat = hab[as.character(locality)]) |>
  summarise(eggs = mean(eggs), .by = habitat)

acct <- fem_share |>
  left_join(clutch_by_hab, by = "habitat") |>
  mutate(
    egg_output = females_per_100 * eggs,
    habitat = factor(habitat, levels = c("Mainland", "Golem Grad island"))
  ) |>
  pivot_longer(c(females_per_100, eggs, egg_output)) |>
  mutate(
    name = recode(name,
      females_per_100 = "Females per 100 adults",
      eggs = "Mean eggs per clutch",
      egg_output = "Relative egg output\n(females × clutch)"
    ),
    name = factor(name, levels = c("Females per 100 adults", "Mean eggs per clutch",
                                   "Relative egg output\n(females × clutch)"))
  )

ggplot(acct, aes(value, fct_rev(habitat), fill = habitat)) +
  geom_col(width = 0.6) +
  geom_text(aes(label = round(value)), hjust = -0.2, size = 3.4, colour = "grey25") +
  facet_wrap(~name, scales = "free_x") +
  scale_fill_manual(values = c(`Golem Grad island` = island_col,
                               Mainland = main_col), guide = "none") +
  scale_x_continuous(expand = expansion(c(0, 0.18))) +
  labs(
    title = "Two modest gaps multiply into a tenfold collapse in egg output",
    subtitle = "Per 100 adults: fewer females × smaller clutches — and nesting frequency isn't even counted here",
    x = NULL, y = NULL
  ) +
  theme(panel.spacing = unit(1.1, "lines"))
```
The two ingredients multiply. The mainland's 100 adults include ~61 females laying
~6 eggs; the island's include ~10 females laying ~3. That is roughly **370 versus 30
units of egg output** — more than a tenfold gap from just two of the measured effects,
and the harassment also depresses how often island females nest at all. A population
producing a fraction of the eggs, with each new female facing the same gauntlet that
emaciated her mother, has no path back to balance on its own.
## A note on what the data can and can't say
This is observational capture–recapture data across three sites, not an experiment.
The sites differ in more than crowding, and capture effort varied by year (the
plateau was sampled far more intensively than the beach or mainland), so the *raw
counts* reflect sampling as well as biology — which is exactly why this page works in
**ratios and per-individual measures** rather than totals. The body-condition and
clutch relationships, though, are within-female biology that sampling intensity does
not distort, and they point the same way the authors' formal model does. The 2083
extinction date is theirs, from an integral projection model; what the public data
let us do is watch the gears of it turn.
::: {.callout-tip collapse="true"}
## Data & sources
Golmetz *et al.* (2026), *"Sex ratio bias triggers demographic suicide in a dense
tortoise population"*, [*Ecology Letters*
70296](https://onlinelibrary.wiley.com/doi/10.1111/ele.70296); data via
[TidyTuesday 2026-03-03](https://github.com/rfordatascience/tidytuesday/tree/main/data/2026/2026-03-03)
(curated by Novica Nakov). 10,174 body-condition captures of ~2,300 individuals;
53 measured clutches. Sites: Plateau and Beach (Golem Grad island), Konjsko (mainland).
:::