---
title: "The Office: what's in the data"
subtitle: "Session 1 · TidyTuesday 2020-03-17 · Grammar layer: data & aesthetic mappings"
date: 2026-09-29
---
::: {.callout-tip icon="false"}
## Session 1 · 2026-09-29 · facilitated by Jon Minton
With six or seven participants, two in the room and the rest joining remotely. No one is named, because no consent record was taken. Design decisions were made live by the group. This page is the workbook as it stood at the end of the session, prepared by Claude Opus 5.5 from the spec files and figures, with reflections added by the facilitator. The session was not recorded, and the page was approved before publishing. [How these sessions work](../../index.qmd).
:::
TidyTuesday for 2020-03-17 covers the US version of *The Office* (NBC, 2005–2013). The week itself ships one table, IMDb ratings per episode, and points to the [`schrute`](https://bradlindblad.github.io/schrute/) R package for the full dialogue. Both are described here.
::: {.callout-tip collapse="true"}
## Reproducing this page
Runs from two CSVs cached in `data/`. The ratings CSV is committed in this repository. The transcripts CSV holds the show's full dialogue, so it is not committed; the second block below rebuilds it locally. To refresh from source:
``` r
# IMDb ratings: the TidyTuesday week
download.file(
  "https://raw.githubusercontent.com/rfordatascience/tidytuesday/main/data/2020/2020-03-17/office_ratings.csv",
  "data/tt-2020-03-17-office_ratings.csv")

# Transcripts: the schrute package's data, read without installing the package
tmp <- tempfile(fileext = ".rda")
download.file(
  "https://raw.githubusercontent.com/bradlindblad/schrute/master/data/theoffice.rda",
  tmp, mode = "wb")
load(tmp)
readr::write_csv(theoffice, "data/schrute-theoffice.csv")
```
Packages: `tidyverse`. Sources: IMDb ratings via [data.world](https://data.world/anujjain7/the-office-imdb-ratings-dataset); transcripts via Brad Lindblad's [`schrute`](https://github.com/bradlindblad/schrute) package (MIT), from fan transcriptions; both through TidyTuesday [2020-03-17](https://github.com/rfordatascience/tidytuesday/tree/main/data/2020/2020-03-17).
:::
```{r setup}
library(tidyverse)

ratings <- read_csv("../../data/tt-2020-03-17-office_ratings.csv", show_col_types = FALSE)
lines   <- read_csv("../../data/schrute-theoffice.csv", show_col_types = FALSE)

n_ep_lines   <- n_distinct(lines$season, lines$episode)
n_characters <- n_distinct(lines$character)
top_speakers <- lines |> count(character, sort = TRUE) |> slice_head(n = 5)
```
## At a glance
| Table | Grain | Rows × columns |
|------------------------|------------------------|------------------------|
| `office_ratings` | one row per episode | `r nrow(ratings)` × `r ncol(ratings)` |
| `theoffice` (schrute) | one row per spoken line | `r format(nrow(lines), big.mark = ",")` × `r ncol(lines)` |
The two tables share `season` and `episode`, which is the join key. The transcript table already carries the IMDb rating, vote count and air date on every line, so it is effectively a line-level table with episode-level columns repeated on each row.
## `office_ratings`: one row per episode
`r nrow(ratings)` episodes across `r n_distinct(ratings$season)` seasons, aired between `r format(min(ratings$air_date), "%B %Y")` and `r format(max(ratings$air_date), "%B %Y")`. IMDb ratings run from `r min(ratings$imdb_rating)` to `r max(ratings$imdb_rating)`, and vote counts from `r format(min(ratings$total_votes), big.mark = ",")` to `r format(max(ratings$total_votes), big.mark = ",")`. There are no missing values.
```{r ratings-head}
head(ratings)
```
| Variable | Type (grammar terms) | Notes |
|------------------------|------------------------|------------------------|
| `season` | discrete\* (`r n_distinct(ratings$season)` levels) | whole numbers, so whether it is discrete or continuous is a decision |
| `episode` | continuous, or ordinal within season | numbering restarts each season |
| `title` | identifier | a label, not an aesthetic |
| `imdb_rating` | continuous | 10 is best |
| `total_votes` | continuous | IMDb users who rated the episode |
| `air_date` | temporal | original US air date |
## `theoffice`: one row per spoken line
`r format(nrow(lines), big.mark = ",")` lines of dialogue from `r n_ep_lines` episodes, spoken by `r n_characters` distinct character labels. The most frequent speakers are `r paste0(top_speakers$character, " (", format(top_speakers$n, big.mark = ",", trim = TRUE), ")", collapse = ", ")`.
```{r lines-head}
lines |>
  mutate(across(c(text, text_w_direction, writer), \(x) str_trunc(x, 40))) |>
  head()
```
| Variable | Type (grammar terms) | Notes |
|------------------------|------------------------|------------------------|
| `index` | identifier / order | running line number across the whole series |
| `season`, `episode`, `episode_name` | discrete | the join key back to `office_ratings` |
| `director`, `writer` | discrete (many levels) | `writer` can hold several names separated by `;` |
| `character` | discrete (`r n_characters` levels) | far too many for colour. Filter or lump first |
| `text`, `text_w_direction` | free text | the second keeps stage directions in brackets |
| `imdb_rating`, `total_votes`, `air_date` | as above | repeated on every line of an episode |
## A first figure: ratings by season and episode
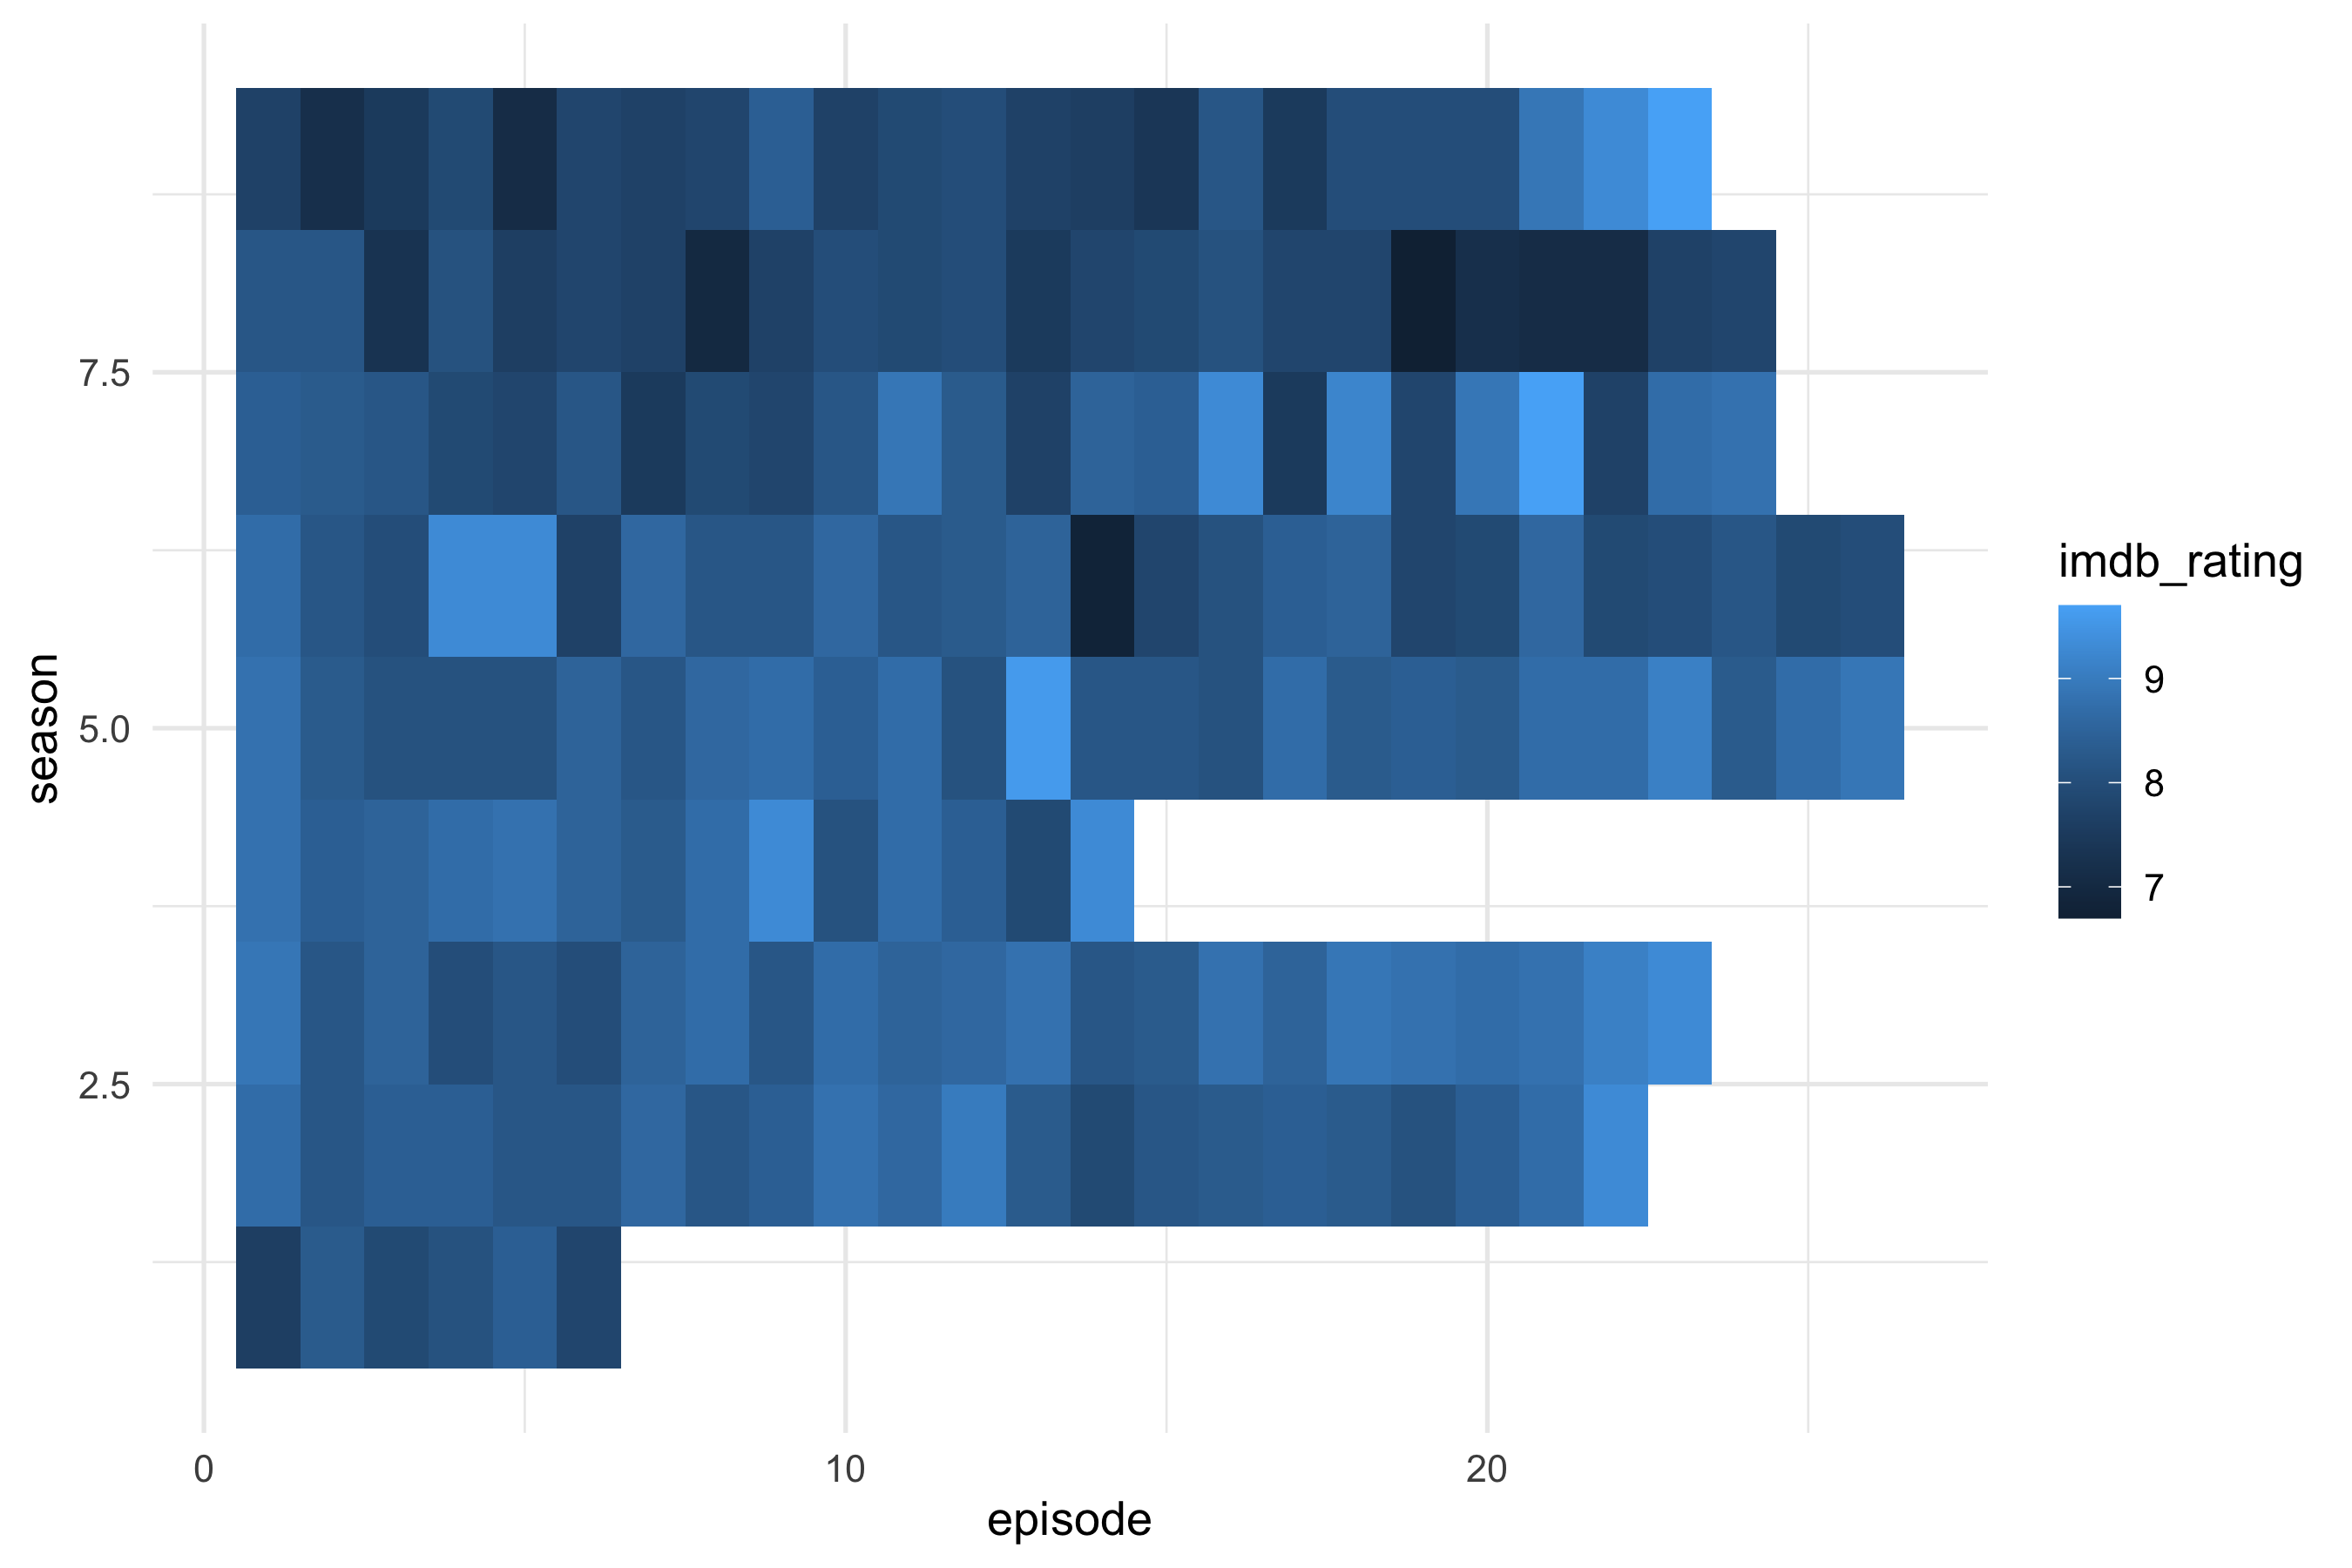
The first spec asked for a heatmap: season as rows, episode number as columns, and IMDb rating as fill. Everything else is left at ggplot2's defaults.
``` yaml
# sessions/2026-09-29/specs/01-office-heatmap.yml
data: tt-2020-03-17-office_ratings
mapping:
  x: episode
  y: season
  fill: imdb_rating
layers:
  - geom: tile
```
```{r fig-heatmap}
#| fig-alt: "Heatmap of IMDb rating for each episode of The Office, seasons as rows and episode number as columns."
ggplot(ratings, aes(x = episode, y = season, fill = imdb_rating)) +
  geom_tile() +
  theme_minimal(base_size = 13)
```
Looking at the render shows three defaults that nobody decided on:
- `season` is stored as a number, so ggplot2 treats it as continuous. The axis shows breaks at 2.5, 5.0 and 7.5, which are seasons that don't exist.
- The default continuous y scale puts season 1 at the bottom and season 9 at the top.
- The default fill gradient runs from dark to light blue, which leaves little contrast across the `r min(ratings$imdb_rating)`–`r max(ratings$imdb_rating)` range.
The ragged right edge shows how many episodes each season had. Season `r ratings |> count(season) |> slice_min(n, n = 1, with_ties = FALSE) |> pull(season)` is the shortest, with `r ratings |> count(season) |> pull(n) |> min()` episodes.
## A second figure: ratings over air date
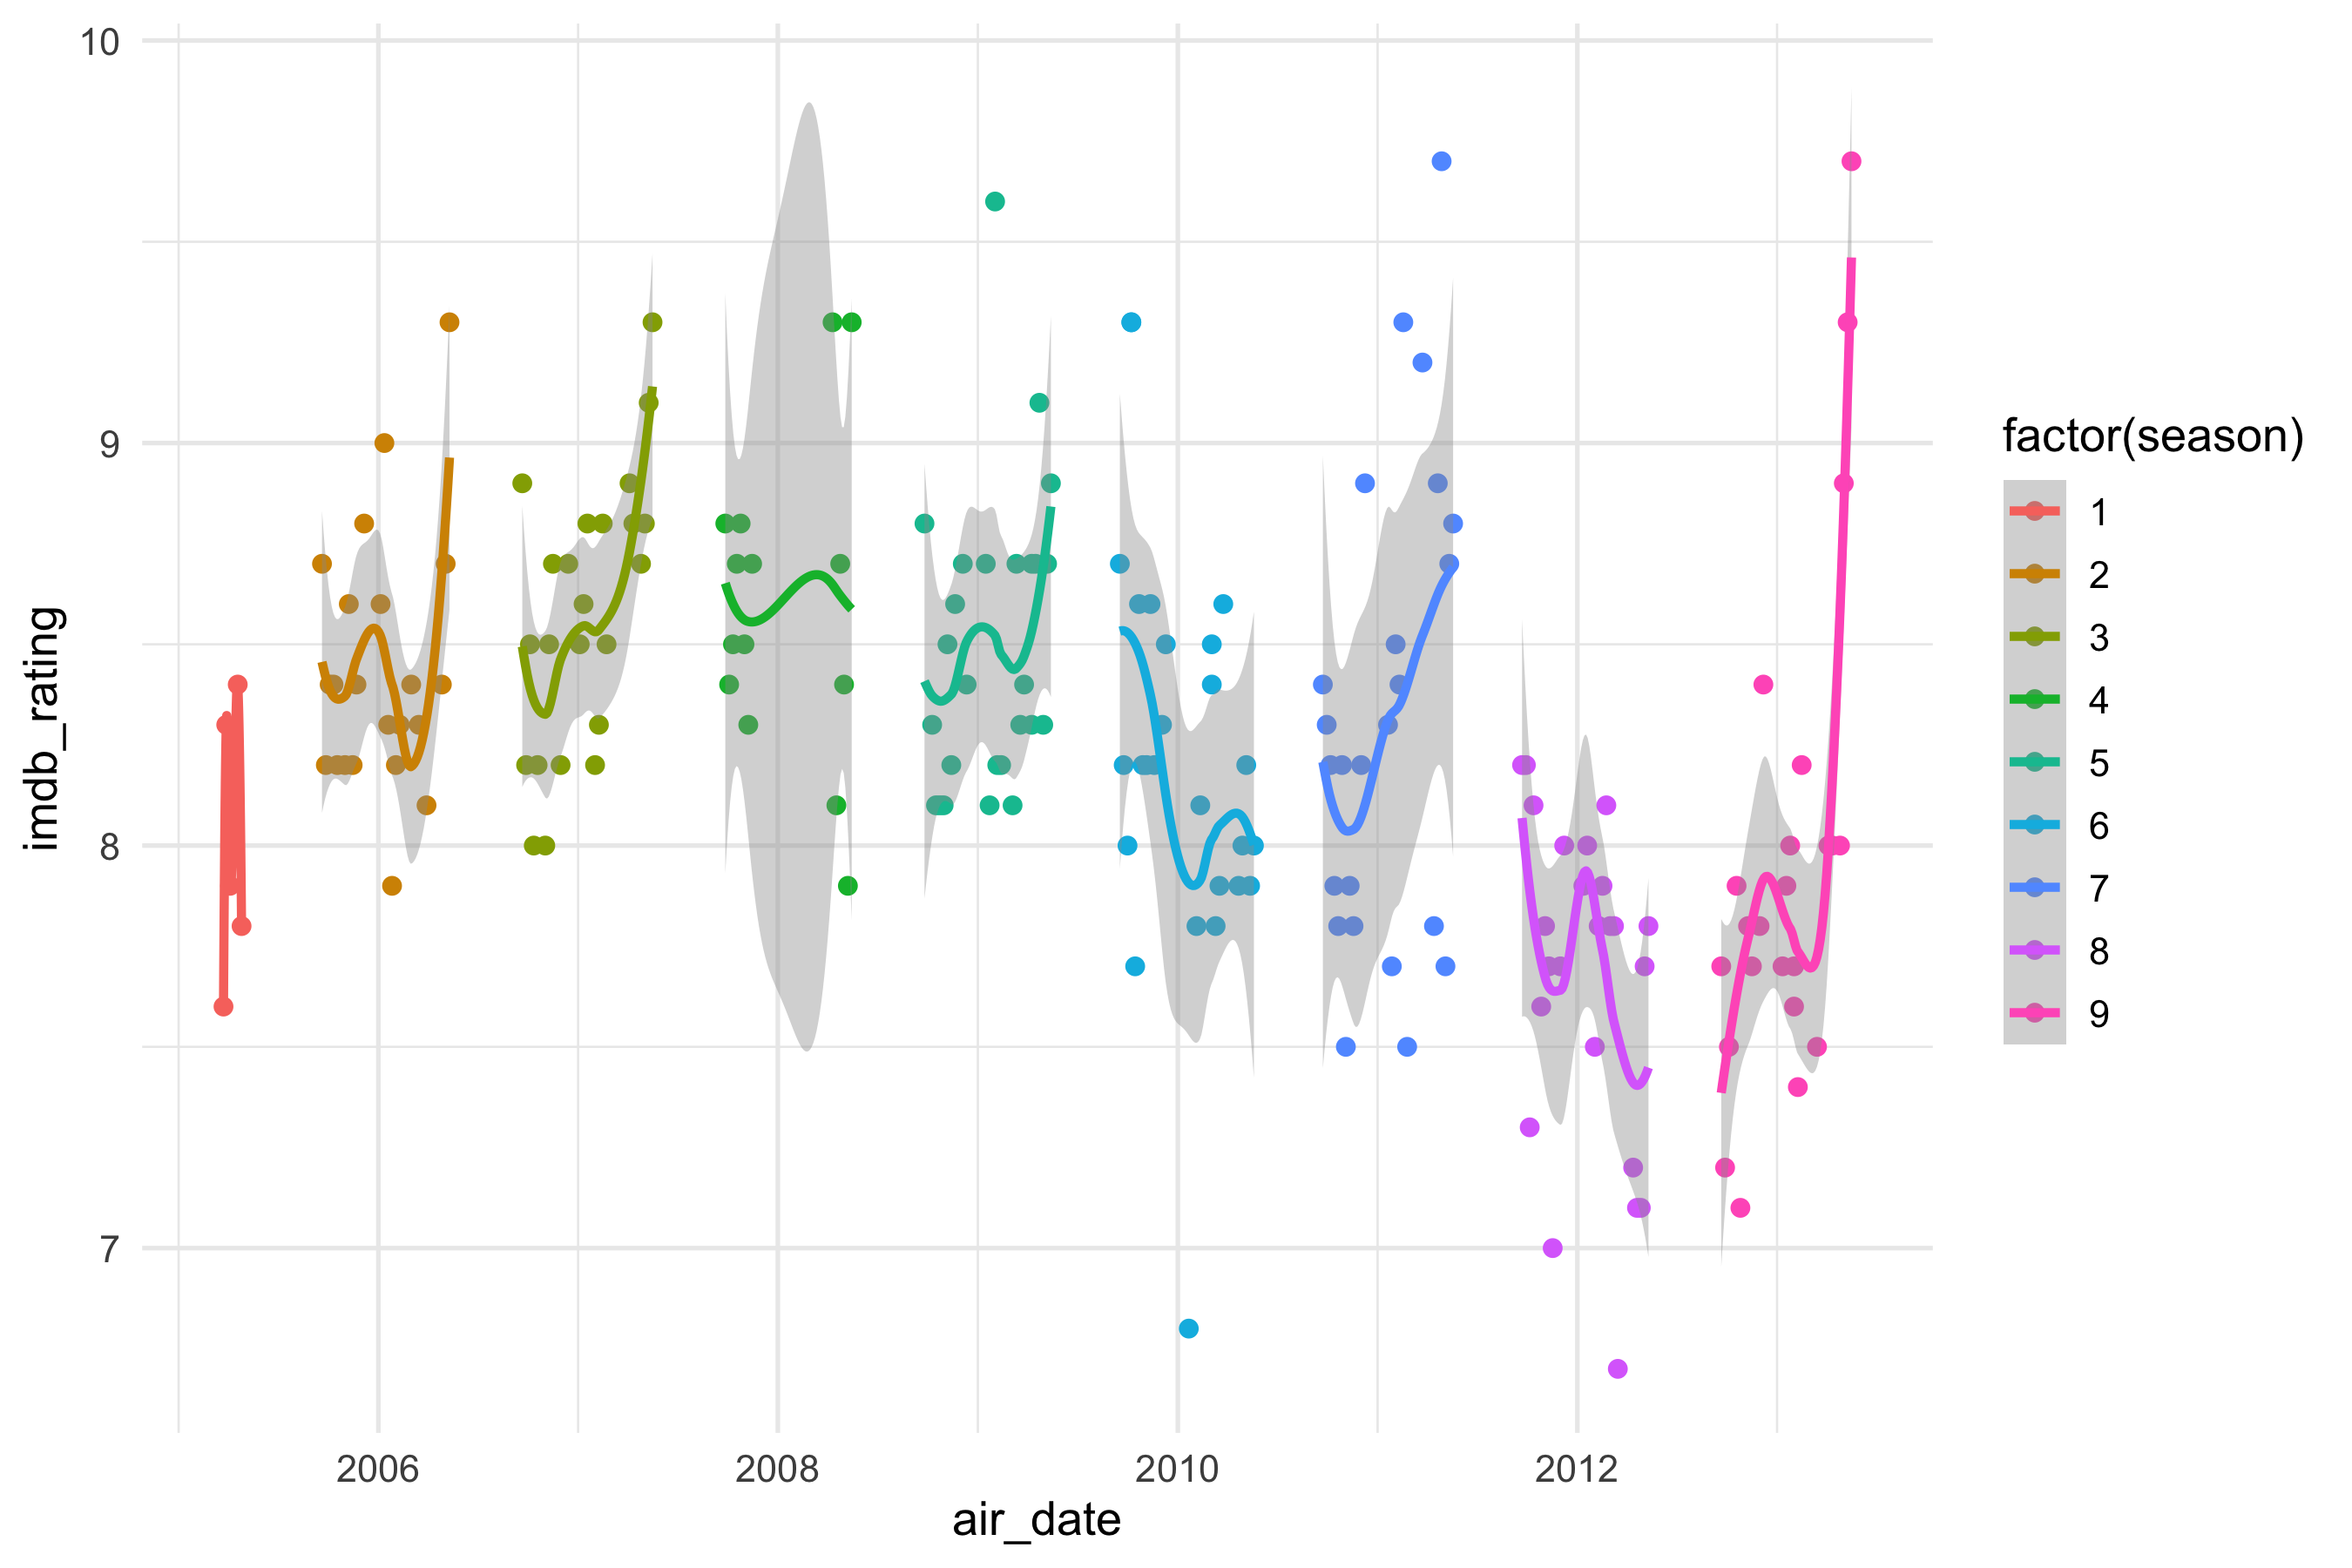
The second spec puts each episode at its air date, colours it by season, and adds a smoother. Two decisions were made before compiling:
- **Season as a category.** `season` is stored as a number, so the spec maps `factor(season)` to colour, which gives one hue per season instead of a gradient. Shape was dropped: ggplot2's default shape palette has only six shapes, so seasons 7–9 would have gone missing.
- **One smoother per season.** Colour is mapped for the whole plot, so the smooth layer inherits it and fits a separate curve to each season.
``` yaml
# sessions/2026-09-29/specs/02-office-airdate.yml
data: tt-2020-03-17-office_ratings
mapping:
  x: air_date
  y: imdb_rating
  colour: factor(season)
layers:
  - geom: point
  - geom: smooth
```
```{r fig-airdate}
#| fig-alt: "IMDb rating of each episode of The Office against air date, coloured by season, with a separate smoother for each season."
ggplot(ratings, aes(x = air_date, y = imdb_rating, colour = factor(season))) +
  geom_point() +
  geom_smooth() +
  theme_minimal(base_size = 13)
```
Looking at the render:
- The smoother defaults to loess, which is very wiggly when seasons are this short (a median of `r ratings |> count(season) |> pull(n) |> median()` episodes). Season 1's `r sum(ratings$season == 1)` episodes give a spike with no confidence ribbon, and R prints a warning while fitting it.
- Season 4's ribbon balloons across a gap in its air dates. Loess is drawing a curve through months with no episodes.
- Several seasons end on a rise, most sharply the finale at `r max(ratings$imdb_rating)`. A flexible smoother bends towards the last point or two, so these end-of-season spikes need checking against the raw points before reading anything into them.
- The legend title is the code `factor(season)`, and the axis titles are raw variable names, because the spec has no `labs` block yet.
## What the data can't say
IMDb ratings come from self-selected raters voting years after broadcast, so they measure how the show is remembered by people who chose to rate it. They don't measure how it was received at the time. The episode counts also differ between tables (`r nrow(ratings)` rated episodes against `r n_ep_lines` in the transcripts). The sources likely split two-part episodes differently. Check any join for dropped rows. The transcripts are fan-made, so character labels are inconsistent: the same person can appear under several spellings, which inflates the character count.
## Reflections on in-person/hybrid session
- Some people had preference for something more GUI/point-and-click rather than the dev-style IDE presented.
- My discussion about text-based ragged data structures, like the YAML/JSON-like universal gg specification offered in the `gg-spec` skill, might have been too close to the bedrock on average.
- Less resistance to CC/Codex taking over implementation tasks than I was expecting.
- Soft support for key argument made: that more of analysts/analytical knowledge workers' time should be spent on the design decisions.
- e.g. I mentioned ggplot2 used to have qplot, but the defaults took too many important design decisions from the user, so was deprecated.
- This is now the 'stuff to sweat', though maybe a gui will help even more
- Less continual iteration over specific visualisation. Didn't get to show committing as like rappeling in rock climbing, and this being an organic process.
Next steps:
- [ ] Get workbook at the end of the session committed and rendered as a page on github pages for showing to attendees.
- [ ] Get a second version of the workshop doc with incremental improvements to visualisation also shown, along with a 'wow' visualisation', such as a 3D plot, and something generated by Opus 5.5 autonomously.
- [ ] Produce a skill with replicates a tableau-style gui way of specifying mapping from dataset features to visual aesthetics in a ggplot2 way. Have this as another page along with some ready datasets to select from.
- [ ] Contextualise what the workshop showed as one key aspect of one of the three modules I'm developing for the Knowledge Tree collection, namely 'Science Supercharged'. Give links and a description to the broader package and illustrative savings in total time through collapsing of implementation time.